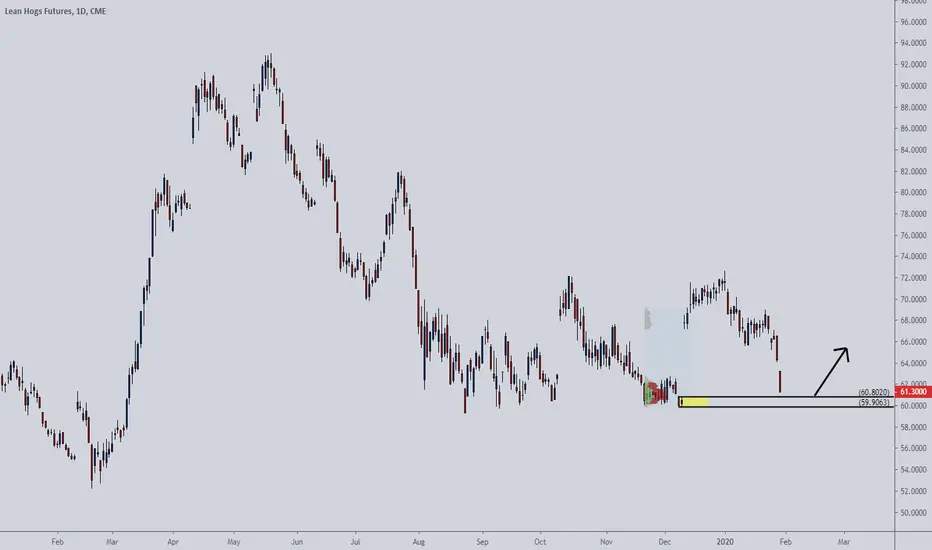
A long red candle has formed on the daily chart. A strong gap down, however, I identified a volume cluster just below the current price. If buyers are strong, they will push the price up again. A strong demand zone is also just below the current price.
Our target is 1 to 1, and the stop is a close, on the daily chart, below the lower line.
Our target is 1 to 1, and the stop is a close, on the daily chart, below the lower line.
כתב ויתור
המידע והפרסומים אינם מיועדים להיות, ואינם מהווים, ייעוץ או המלצה פיננסית, השקעתית, מסחרית או מכל סוג אחר המסופקת או מאושרת על ידי TradingView. קרא עוד ב־תנאי השימוש.
כתב ויתור
המידע והפרסומים אינם מיועדים להיות, ואינם מהווים, ייעוץ או המלצה פיננסית, השקעתית, מסחרית או מכל סוג אחר המסופקת או מאושרת על ידי TradingView. קרא עוד ב־תנאי השימוש.