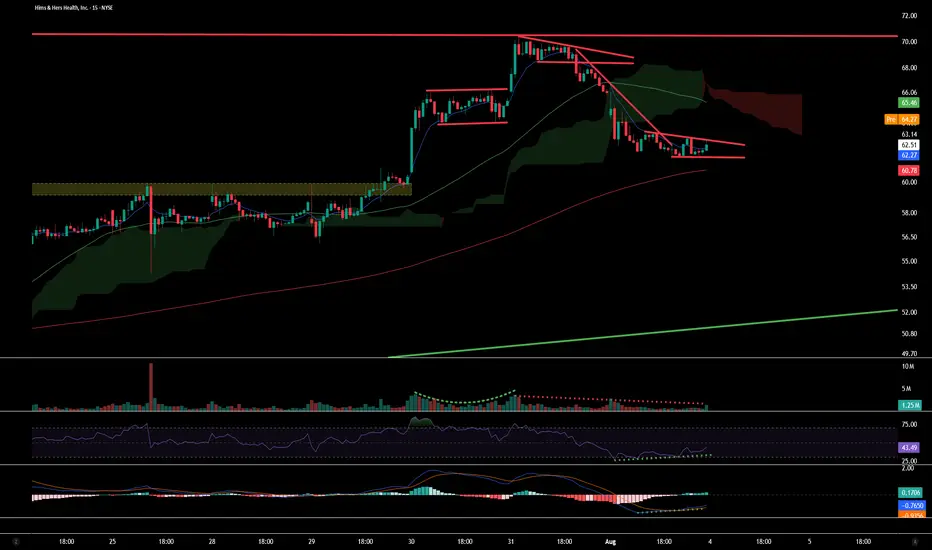
On the 15m Chart, you can see a bull flag and pennant form which broke down with confluence from MACD and RSI showing downside pressure. forming a bear pennant. However, both indicators are now flashing bullish divergence — price action is printing lower lows, while RSI and MACD are printing higher lows.
Premarket has broken above above the pennant, confirming the divergence.
כתב ויתור
המידע והפרסומים אינם מיועדים להיות, ואינם מהווים, ייעוץ או המלצה פיננסית, השקעתית, מסחרית או מכל סוג אחר המסופקת או מאושרת על ידי TradingView. קרא עוד ב־תנאי השימוש.
כתב ויתור
המידע והפרסומים אינם מיועדים להיות, ואינם מהווים, ייעוץ או המלצה פיננסית, השקעתית, מסחרית או מכל סוג אחר המסופקת או מאושרת על ידי TradingView. קרא עוד ב־תנאי השימוש.