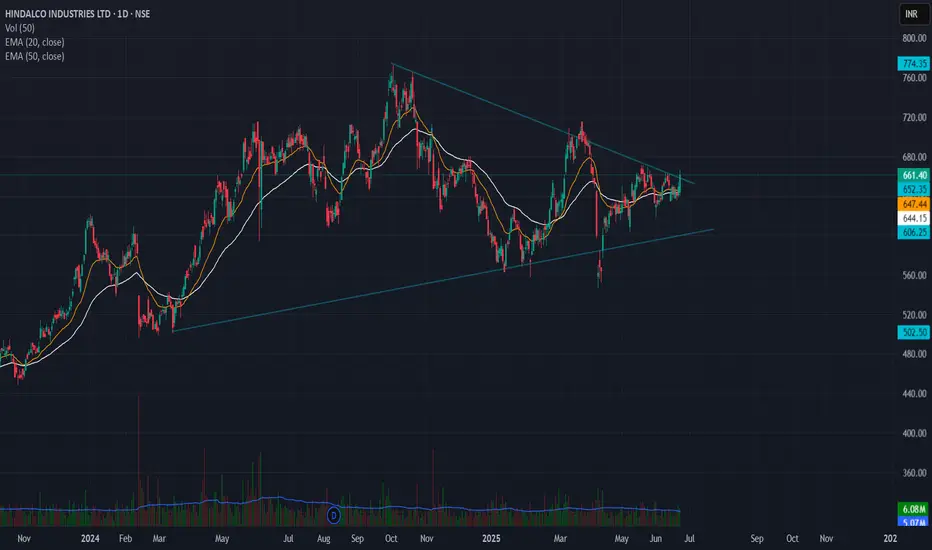
🔹 Pattern: Symmetrical Triangle
🔹 Breakout Level: ₹660
🔹 Stoploss: ₹635 (below swing low)
🔹 Target Zone: ₹850 – ₹900
🔹 Risk–Reward: 7.6 – 9.6
🔹 Timeframe: Positional (swing to medium term)
---
📊 Chart Analysis:
Hindalco has broken out of a well-defined symmetrical triangle on the daily chart, with strong price compression followed by bullish breakout confirmation.
The triangle height is ~₹200, projected from the breakout zone, giving a target range of ₹850–₹900.
🧠 Stoploss placed below the last swing low inside the triangle to avoid false breakdown traps.
כתב ויתור
המידע והפרסומים אינם מיועדים להיות, ואינם מהווים, ייעוץ או המלצה פיננסית, השקעתית, מסחרית או מכל סוג אחר המסופקת או מאושרת על ידי TradingView. קרא עוד ב־תנאי השימוש.
כתב ויתור
המידע והפרסומים אינם מיועדים להיות, ואינם מהווים, ייעוץ או המלצה פיננסית, השקעתית, מסחרית או מכל סוג אחר המסופקת או מאושרת על ידי TradingView. קרא עוד ב־תנאי השימוש.