Hindustan Copper (HINDCOPPER) – Multi-Year Triangle Breakout with Educational Trade Analysis
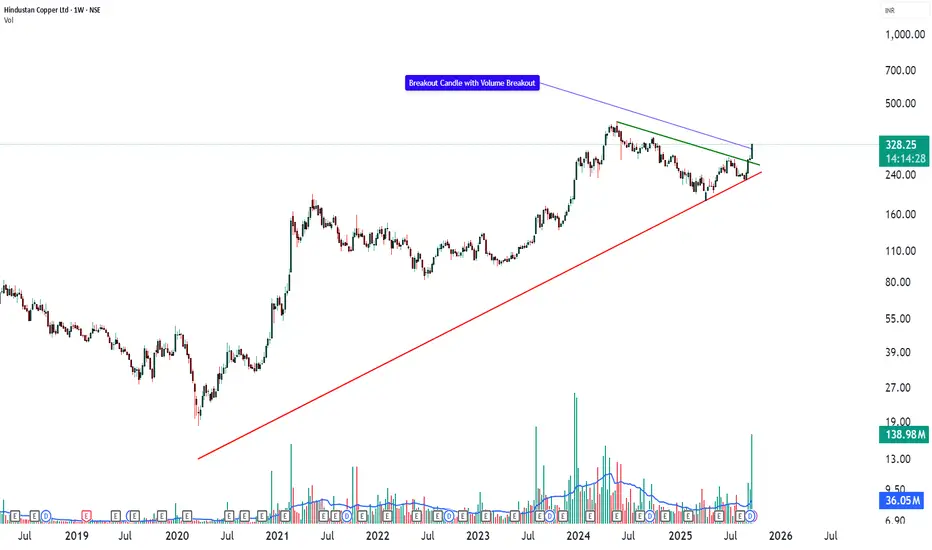
Hindustan Copper Ltd. (CMP: ₹328) has delivered a decisive breakout on the weekly chart. The stock had been compressing within a multi-year symmetrical triangle formed by a rising trendline from the 2020 lows (red) and a descending resistance from the 2022 highs (green). The most recent candle shows a sharp +16% surge with strong volume, pushing price above the descending trendline and signaling a potential continuation of the long-term uptrend.
From a technical perspective, ₹250–260 remains a key support zone, while the next major resistance cluster lies near ₹400–420, which aligns with the measured-move projection from the triangle’s height. This price structure sets up an instructive case study in pattern breakouts for market participants.
Fundamentally, Hindustan Copper enjoys a unique monopoly as India’s only fully integrated copper producer, covering mining through to refined products. It commands a vast resource base of roughly 755 million tonnes of copper ore, providing decades of visibility. Management is working to ramp mining capacity from 4 MTPA to 12.2 MTPA, led by the historic Rakha mine restart and multiple underground expansions. FY25 was a landmark year with ₹2,071 crore revenue and ₹469 crore PAT, and Q1 FY26 has already delivered an ~18 % YoY PAT growth. The balance sheet is healthy and nearly debt-free, offering flexibility to fund expansion.
On the macro side, global copper demand is in a structural uptrend, driven by EV adoption, renewable energy installations, and power-grid upgrades. Supply disruptions at major global mines have tightened the market, creating a favorable price backdrop for Hindustan Copper.
📝 Educational Trade Analysis
For traders studying breakouts, this setup offers a clear example of blending chart structure with fundamental support. A typical learning plan could observe a hypothetical entry zone on a sustained close above ₹335–340, with illustrative targets near ₹400 and ₹450, which correspond to the pattern’s measured move. A protective stop for case-study purposes might be placed around ₹295, just below the breakout and the 50-week moving average.
These levels are for educational illustration only—not a recommendation to buy or sell.
This integrated perspective shows how a commodity-backed PSU with strong fundamentals and an expansion pipeline can align with a technically significant breakout, offering a valuable lesson in combining price action with fundamental drivers.
⚠️ Disclosure & Disclaimer – Please Read Carefully
I/we have no financial interest or position in Hindustan Copper at the time of writing.
The information shared here is meant purely for learning and awareness. It is not a buy or sell recommendation and should not be taken as investment advice. I am not a SEBI-registered investment adviser, and all views expressed are based on personal study, chart patterns, and publicly available market data.
Trading—whether in stocks or options—carries risk. Markets can move unexpectedly, and losses can sometimes exceed the money you have invested. Past performance or past setups do not guarantee future results.
If you are a beginner, treat this as a guide to understand how the market works and practice on paper trades before risking real money. If you are experienced, always assess your own risk, position sizing, and strategy suitability before entering trades.
Consult a SEBI-registered financial adviser before making any real trading decision. By engaging with this content, you acknowledge full responsibility for your trades and investments.
💬 Found this useful?
🔼 Give this post a Boost to help more traders discover clean, structured learning.
✍️ Drop your thoughts, questions, or setups in the comments — let’s grow together!
🔁 Share with fellow traders and beginners to spread awareness.
👉 “If you liked this breakdown, follow for more clean, structured setups with discipline at the core.”
🚀 Stay Calm. Stay Clean. Trade With Patience.
Trade Smart | Learn Zones | Be Self-Reliant 📊
STWP | Mentor & Demand-Supply Specialist | Empowering traders through structured learning |
simpletradewithpatience.com
Community: chat.whatsapp.com/BEYz0tkqP0fJPBCWf59uel
wa.me/message/6IOPHGOXMGZ4N1
Educational Only
simpletradewithpatience.com
Community: chat.whatsapp.com/BEYz0tkqP0fJPBCWf59uel
wa.me/message/6IOPHGOXMGZ4N1
Educational Only
כתב ויתור
המידע והפרסומים אינם מיועדים להיות, ואינם מהווים, ייעוץ או המלצה פיננסית, השקעתית, מסחרית או מכל סוג אחר המסופקת או מאושרת על ידי TradingView. קרא עוד ב־תנאי השימוש.