Cup and Handle Breakout Trade Setup on HIRECT (Daily Chart)
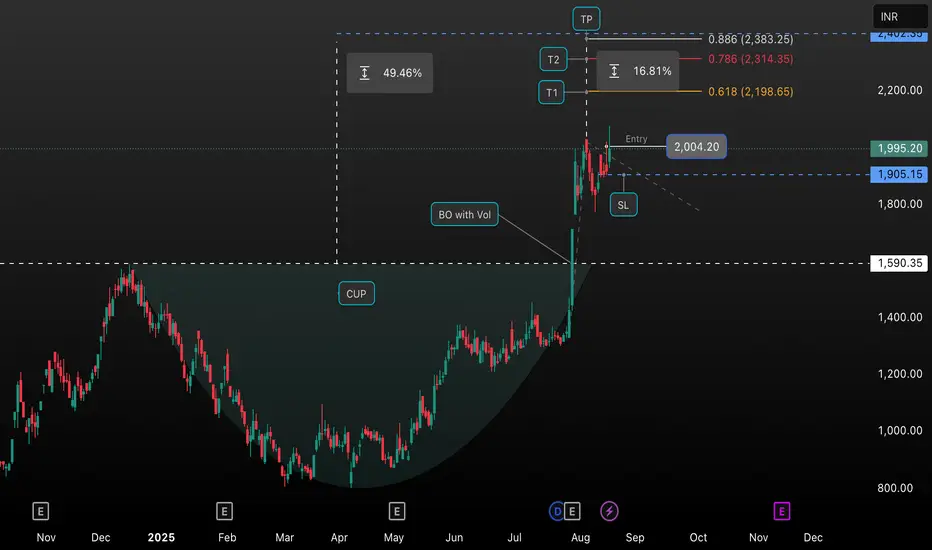
This chart illustrates a classic “Cup and Handle” breakout pattern on HIRECT, identified on the daily time frame. After forming a well-defined cup, the stock witnessed a significant breakout with increased volume (“BO with Vol”), signaling strong bullish momentum. Entry was triggered at ₹2,004.20, just above the handle resistance, with a suggested stop-loss (SL) below the breakout level at approximately ₹1,905.15.
The chart highlights multiple target zones (T1, T2, TP), based on Fibonacci extension levels and price action analysis:
• T1: 2,198.65 (61.8% Fibonacci extension)
• T2: 2,314.35 (78.6% extension)
• TP (Target Point): 2,383.25 (88.6% extension)
The setup indicates a potential upside move of about 49.46% from the cup base to the target point. To manage risk, the stop loss is set below breakout support. This setup is ideal for traders seeking a high-probability entry following a technical breakout pattern in a trending stock.
כתב ויתור
המידע והפרסומים אינם אמורים להיות, ואינם מהווים, עצות פיננסיות, השקעות, מסחר או סוגים אחרים של עצות או המלצות שסופקו או מאושרים על ידי TradingView. קרא עוד בתנאים וההגבלות.
כתב ויתור
המידע והפרסומים אינם אמורים להיות, ואינם מהווים, עצות פיננסיות, השקעות, מסחר או סוגים אחרים של עצות או המלצות שסופקו או מאושרים על ידי TradingView. קרא עוד בתנאים וההגבלות.