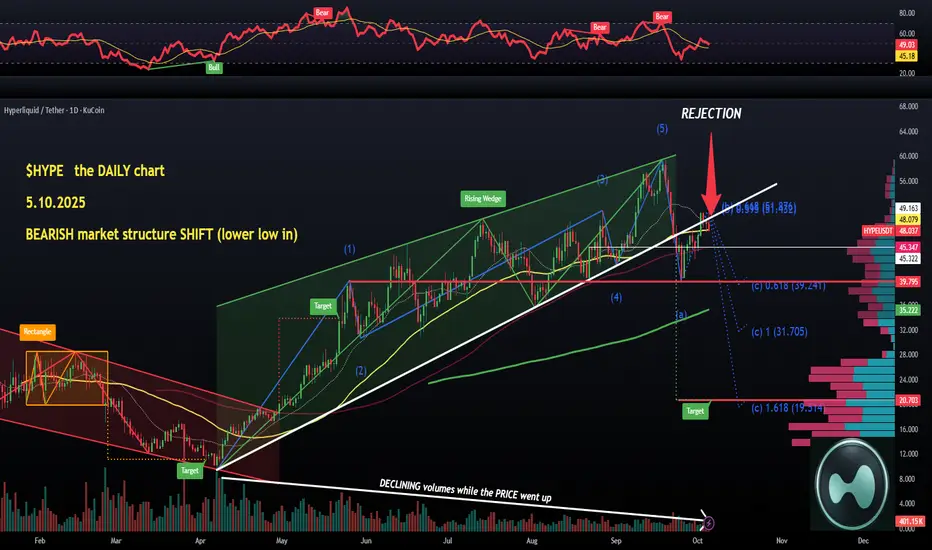
I called for a crash at $55-56 due to the RISING WEDGE accompanied by recurring RSI bear divergences. I even shorted it after the pattern's BREAKDOWN and that was WAVE A, which played out perfectly dropping a touch below the $40 mark.
Then we obviously had WAVE B (which in Elliot's Wave Theory is a 'dead cat bounce', in most cases). That pushed the price above $50 briefly, bull-trapped a lot of people, and gave us a bearish retest of the RISING WEDGE breakdown.
WAVE A also established a lower low, and if the WAVE B is complete (lower high!), then we can call it a BEARISH market structure.
So now it would be a WAVE C which is a proper correction with the initial target of $39.25 (huge amounts of LIQUIDATIONS below $40, see the attached heatmap). Other targets are: $31.7 and $20 (which is also the WEDGE breakdown target, coincidence?).
I'm trying hard to find some positives about the DAILY chart, there is literally nothing. Even the volumes have been falling like a stone from April (when #hype started its uptrend from $9.3). I call that BEARISH volume divergence.
I'm not even gonna go into the upcoming unlocks again, or the impact of #aster and its crazy volumes and revenues.
The DAILY is just a disaster, and I'm really tempted to hunt for a short here. Not on Sunday, though.
Patience💙👽
כתב ויתור
המידע והפרסומים אינם אמורים להיות, ואינם מהווים, עצות פיננסיות, השקעות, מסחר או סוגים אחרים של עצות או המלצות שסופקו או מאושרים על ידי TradingView. קרא עוד בתנאים וההגבלות.
כתב ויתור
המידע והפרסומים אינם אמורים להיות, ואינם מהווים, עצות פיננסיות, השקעות, מסחר או סוגים אחרים של עצות או המלצות שסופקו או מאושרים על ידי TradingView. קרא עוד בתנאים וההגבלות.