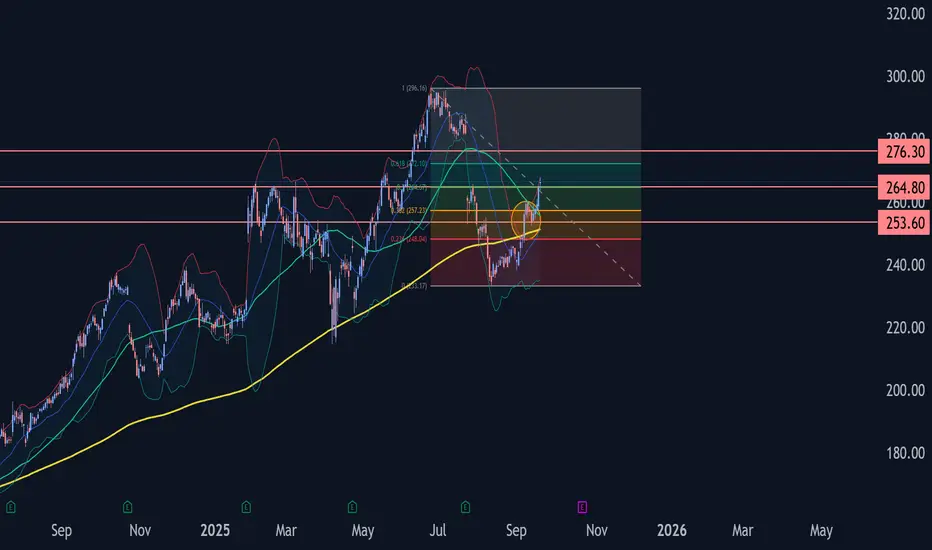
- IBM broke resistance level 264.80
- Likely to rise to resistance level 276.30
IBM recently broke the resistance zone between the resistance level 264.80 (which stopped the previous wave (ii) in July) and the 50% Fibonacci correction of the ABC correction (4) from June.
The breakout of this resistance zone continues the active short-term impulse wave 3 from the start of September.
Given the clear daily uptrend, IBM can be expected to rise to the next resistance level 276.30 (former support from June).
By the FxPro Analyst Team
Follow our dedicated Telegram channel t.me/fxpro for insightful market analysis and expert commentary.
Reach out to media.comments@fxpro.com for PR and media inquiries
Follow our dedicated Telegram channel t.me/fxpro for insightful market analysis and expert commentary.
Reach out to media.comments@fxpro.com for PR and media inquiries
כתב ויתור
המידע והפרסומים אינם מיועדים להיות, ואינם מהווים, ייעוץ או המלצה פיננסית, השקעתית, מסחרית או מכל סוג אחר המסופקת או מאושרת על ידי TradingView. קרא עוד ב־תנאי השימוש.