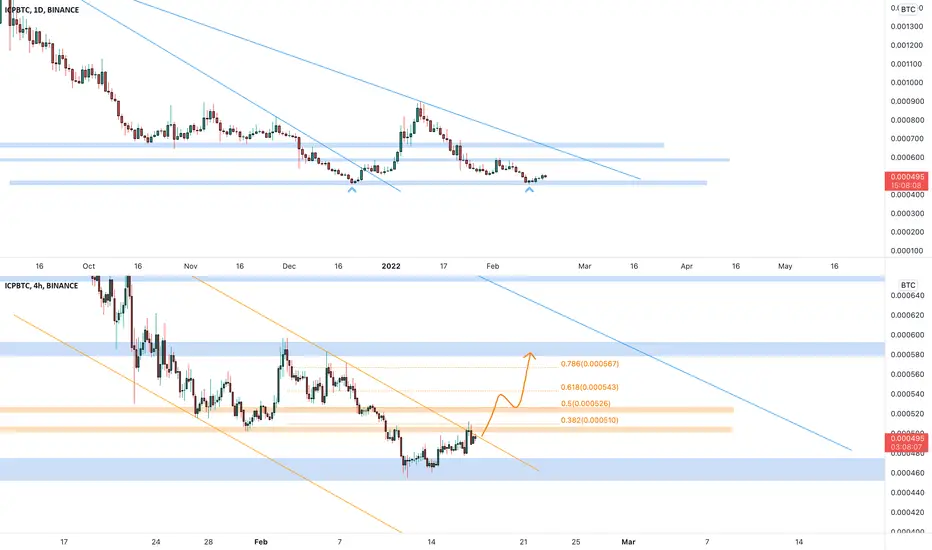
ICPBTC:The price is creating a double bottom on the daily timeframe on 0.000453 as you can see on the upper chart (daily timeframe)
On the 4h Timeframe, the price is testing a descending channel and the static resistance. Using the Fibonacci Retracement we can see that the price is testing the 0.382 Fibonacci level as well.
How to approach?
If the price is going to have a breakout from the descending channel with Volume, According to Plancton's strategy, we can set a nice order
–––––
Keep in mind.
–––––
Follow the Shrimp 🦐
On the 4h Timeframe, the price is testing a descending channel and the static resistance. Using the Fibonacci Retracement we can see that the price is testing the 0.382 Fibonacci level as well.
How to approach?
If the price is going to have a breakout from the descending channel with Volume, According to Plancton's strategy, we can set a nice order
–––––
Keep in mind.
- 🟣 Purple structure -> Monthly structure.
- 🔴 Red structure -> Weekly structure.
- 🔵 Blue structure -> Daily structure.
- 🟡 Yellow structure -> 4h structure.
–––––
Follow the Shrimp 🦐
הערה
The price is testing the 4h resistance after the breakout from the descending channel. We are waiting for a clear breakoutכתב ויתור
המידע והפרסומים אינם אמורים להיות, ואינם מהווים, עצות פיננסיות, השקעות, מסחר או סוגים אחרים של עצות או המלצות שסופקו או מאושרים על ידי TradingView. קרא עוד בתנאים וההגבלות.
כתב ויתור
המידע והפרסומים אינם אמורים להיות, ואינם מהווים, עצות פיננסיות, השקעות, מסחר או סוגים אחרים של עצות או המלצות שסופקו או מאושרים על ידי TradingView. קרא עוד בתנאים וההגבלות.