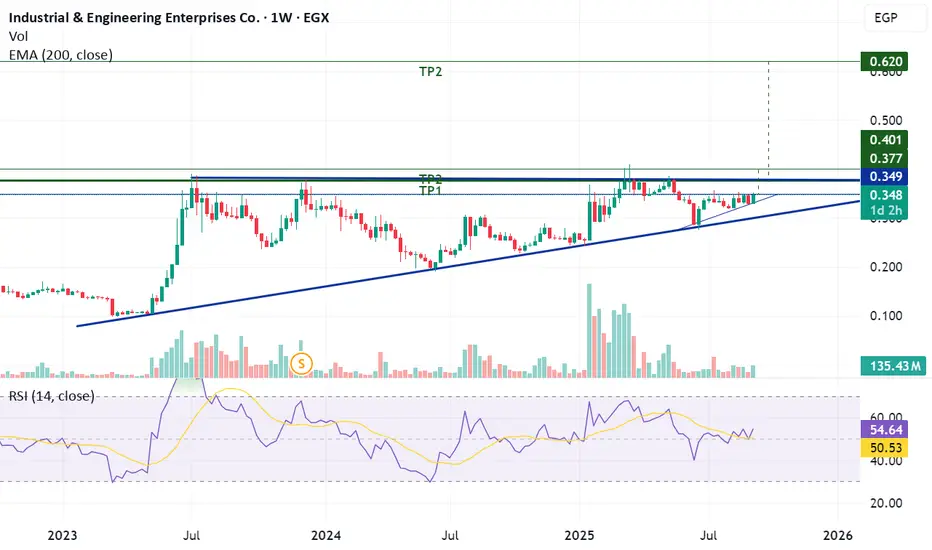
On the weekly chart, the stock is forming an ascending triangle. On the daily chart, it is also moving within a smaller ascending triangle.
- Short term: If the price breaks 0.35 and holds above it, targets are 0.378 – 0.40.
- Medium to long term: If the price stabilizes above 0.40, the target becomes 0.62 (measured target of the ascending triangle on the weekly chart).
⚠ Stop loss after confirming above 0.35: 0.33
כתב ויתור
המידע והפרסומים אינם מיועדים להיות, ואינם מהווים, ייעוץ או המלצה פיננסית, השקעתית, מסחרית או מכל סוג אחר המסופקת או מאושרת על ידי TradingView. קרא עוד ב־תנאי השימוש.
כתב ויתור
המידע והפרסומים אינם מיועדים להיות, ואינם מהווים, ייעוץ או המלצה פיננסית, השקעתית, מסחרית או מכל סוג אחר המסופקת או מאושרת על ידי TradingView. קרא עוד ב־תנאי השימוש.