Here’s a **condensed Wyckoff Accumulation Analysis** based on your most recent chart for **Indian Energy Exchange Ltd. (IEX)**:
---
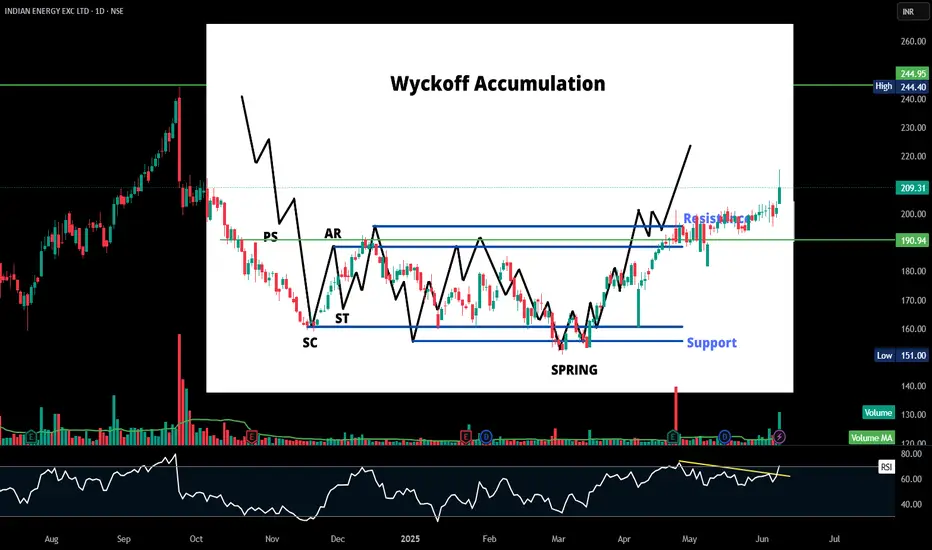
🔍 **Key Wyckoff Phases & Levels:**
* **PS (Preliminary Support):** Initial slowing of the downtrend.
* **SC (Selling Climax):** Sharp selloff forming the bottom.
* **AR (Automatic Rally):** First bounce confirming initial demand.
* **ST (Secondary Test):** Testing previous lows around SC.
* **Spring:** Fakeout below support, creating panic-selling before reversal.
* **Markup Phase:** Breakout above resistance, transitioning to uptrend.
---
📈 **Critical Price Zones:**
* **Support:** \~₹203 and 190
* **Resistance:** \~255
---
⚡ **Technical Indicators:**
* **RSI:** Above 60 with breakout, suggesting strong momentum.
* **Volume:** Increased volume on breakout candles signals institutional accumulation.
---
💡 **Conclusion:**
IEX has confirmed the Wyckoff accumulation pattern and is now in the **markup phase**, targeting ₹245 to 255 if it sustains above ₹203 and 190.
---
🔍 **Key Wyckoff Phases & Levels:**
* **PS (Preliminary Support):** Initial slowing of the downtrend.
* **SC (Selling Climax):** Sharp selloff forming the bottom.
* **AR (Automatic Rally):** First bounce confirming initial demand.
* **ST (Secondary Test):** Testing previous lows around SC.
* **Spring:** Fakeout below support, creating panic-selling before reversal.
* **Markup Phase:** Breakout above resistance, transitioning to uptrend.
---
📈 **Critical Price Zones:**
* **Support:** \~₹203 and 190
* **Resistance:** \~255
---
⚡ **Technical Indicators:**
* **RSI:** Above 60 with breakout, suggesting strong momentum.
* **Volume:** Increased volume on breakout candles signals institutional accumulation.
---
💡 **Conclusion:**
IEX has confirmed the Wyckoff accumulation pattern and is now in the **markup phase**, targeting ₹245 to 255 if it sustains above ₹203 and 190.
כתב ויתור
המידע והפרסומים אינם אמורים להיות, ואינם מהווים, עצות פיננסיות, השקעות, מסחר או סוגים אחרים של עצות או המלצות שסופקו או מאושרים על ידי TradingView. קרא עוד בתנאים וההגבלות.
כתב ויתור
המידע והפרסומים אינם אמורים להיות, ואינם מהווים, עצות פיננסיות, השקעות, מסחר או סוגים אחרים של עצות או המלצות שסופקו או מאושרים על ידי TradingView. קרא עוד בתנאים וההגבלות.