📊 Current snapshot
Last quoted price: approx ₹540.75 (as of 11 Nov 2025).
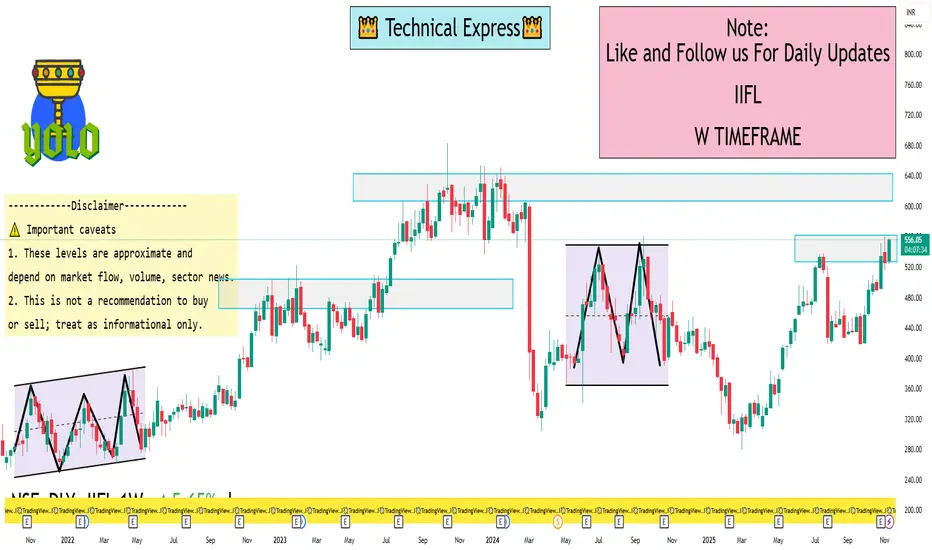
1-week return: ~ +0.09%.
52-week high / low: ~ ₹559.75 / ~ ₹279.80.
🔍 1-Week level view
Given the current price and recent behaviour, here are some approximate support/resistance zones for the coming week:
Support zone: around ₹ 520-530. (if price dips, this may be an area where buyers step in)
Resistance zone: around ₹ 555-560. (near the recent high end of the range)
Neutral range: ~₹ 530-550 — staying in this band if no strong momentum emerges.
Upside breakout scenario: if it convincingly breaks above ~₹ 560, the next target may be ~₹ 570-580.
Downside break scenario: if it falls below ~₹ 520, it could test ~₹ 500 or lower in the short term.
⚠️ Important caveats
These levels are approximate and depend on market flow, volume, sector news.
This is not a recommendation to buy or sell; treat as informational only.
NBFC stocks like IIFL can be sensitive to credit/regulation news, which can quickly shift the technicals.
The “1-week” view means the horizon is short; volatility could cause levels to be breached.
Last quoted price: approx ₹540.75 (as of 11 Nov 2025).
1-week return: ~ +0.09%.
52-week high / low: ~ ₹559.75 / ~ ₹279.80.
🔍 1-Week level view
Given the current price and recent behaviour, here are some approximate support/resistance zones for the coming week:
Support zone: around ₹ 520-530. (if price dips, this may be an area where buyers step in)
Resistance zone: around ₹ 555-560. (near the recent high end of the range)
Neutral range: ~₹ 530-550 — staying in this band if no strong momentum emerges.
Upside breakout scenario: if it convincingly breaks above ~₹ 560, the next target may be ~₹ 570-580.
Downside break scenario: if it falls below ~₹ 520, it could test ~₹ 500 or lower in the short term.
⚠️ Important caveats
These levels are approximate and depend on market flow, volume, sector news.
This is not a recommendation to buy or sell; treat as informational only.
NBFC stocks like IIFL can be sensitive to credit/regulation news, which can quickly shift the technicals.
The “1-week” view means the horizon is short; volatility could cause levels to be breached.
WhatsApp: wa.link/adyqmn
Contact - +91 99997 64120
| Email: techncialexpress@gmail.com
| Script Coder | Trader | Investor | From India
Contact - +91 99997 64120
| Email: techncialexpress@gmail.com
| Script Coder | Trader | Investor | From India
פרסומים קשורים
כתב ויתור
המידע והפרסומים אינם מיועדים להיות, ואינם מהווים, ייעוץ או המלצה פיננסית, השקעתית, מסחרית או מכל סוג אחר המסופקת או מאושרת על ידי TradingView. קרא עוד ב־תנאי השימוש.