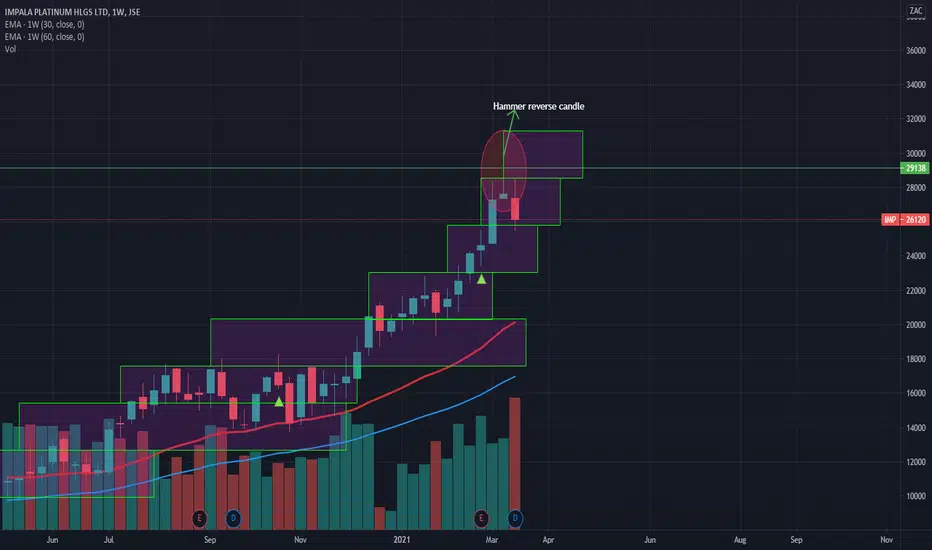
There’s a classic hammer reversal candle on the weekly chart. Which was subsequently followed by a bearish candle. This is a typically bearish signal. However, I still believe we in a bull market. If indeed The hammer trade proves right and the stock falls I will be stopped out at 23202c . As the stock moves to a lower box. But if that trade doesn’t play out and the stock moves higher. I will add to my position if we get a close above 29138c. This would be a multi year high close. The last time this stock closed higher than 29138c was in July 2008.
Trade Summary 22 March 2021
Average entry: 21962c
Position size: 16.4
Stop loss: 23202c
Risk: +20336c
Risk%: +2.44%
Dividends received 13120c.
Trade Summary 22 March 2021
Average entry: 21962c
Position size: 16.4
Stop loss: 23202c
Risk: +20336c
Risk%: +2.44%
Dividends received 13120c.
כתב ויתור
המידע והפרסומים אינם אמורים להיות, ואינם מהווים, עצות פיננסיות, השקעות, מסחר או סוגים אחרים של עצות או המלצות שסופקו או מאושרים על ידי TradingView. קרא עוד בתנאים וההגבלות.
כתב ויתור
המידע והפרסומים אינם אמורים להיות, ואינם מהווים, עצות פיננסיות, השקעות, מסחר או סוגים אחרים של עצות או המלצות שסופקו או מאושרים על ידי TradingView. קרא עוד בתנאים וההגבלות.