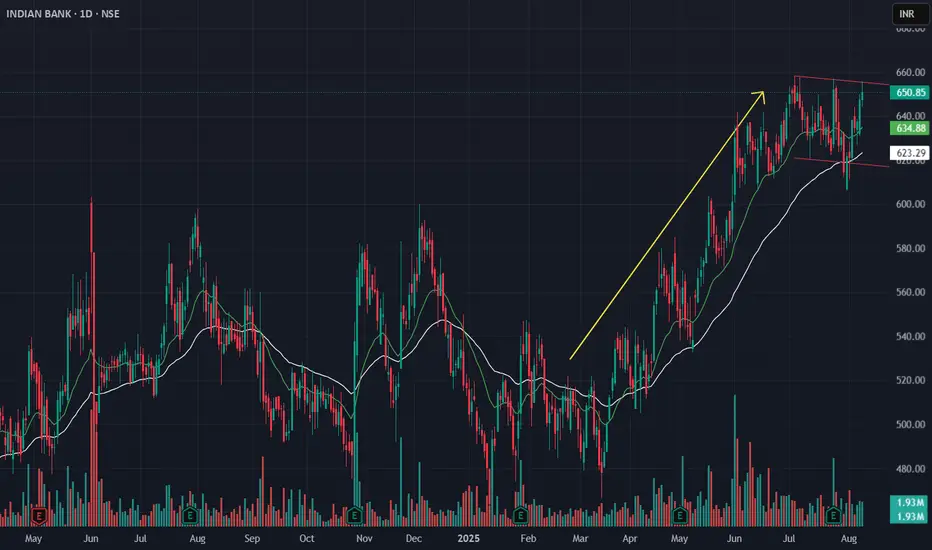
In the latest sector rotation review, PSU Banks moved into the Improving quadrant, showing early signs of leadership. Within this space, Indian Bank was shortlisted based on:
-- Alignment of 9 EMA & 21 EMA across daily and weekly timeframes
-- MACD trending positively
-- EFI (Elders Force Index) showing accumulation on higher timeframes
Technical Structure:
On the Daily and Weekly charts, Indian Bank is consolidating in a flag pattern after a strong uptrend. The EMAs are acting as dynamic support. On the Hourly chart, a rounding base is forming, indicating early recovery of momentum.
Trade Plan:
-- Breakout Entry: Above ₹656 with strong volume
-- Stop Loss: ₹640 (ATR-based)
-- Targets: ₹695 → ₹716 → ₹746
This setup aligns both with sector momentum and technical structure, offering a favorable risk–reward. Watch for sustained momentum on the breakout day to confirm entry.
כתב ויתור
המידע והפרסומים אינם מיועדים להיות, ואינם מהווים, ייעוץ או המלצה פיננסית, השקעתית, מסחרית או מכל סוג אחר המסופקת או מאושרת על ידי TradingView. קרא עוד ב־תנאי השימוש.
כתב ויתור
המידע והפרסומים אינם מיועדים להיות, ואינם מהווים, ייעוץ או המלצה פיננסית, השקעתית, מסחרית או מכל סוג אחר המסופקת או מאושרת על ידי TradingView. קרא עוד ב־תנאי השימוש.