Why  INDIGOPNTS Could Be Your Next Multi-Bagger: Breaking Out After a Brutal 60% Correction Post Good Q2 FY26 Numbers: Let's Analyze in Chart of The Week
As per the Latest SEBI Mandate, this isn't a Trading/Investment RECOMMENDATION nor for Educational Purposes; it is just for Informational purposes only. The chart data used is 3 Months old, as Showing Live Chart Data is not allowed according to the New SEBI Mandate.
Disclaimer: "I am not a SEBI REGISTERED RESEARCH ANALYST AND INVESTMENT ADVISER."
This analysis is intended solely for informational purposes and should not be interpreted as financial advice. It is advisable to consult a qualified financial advisor or conduct thorough research before making investment decisions.
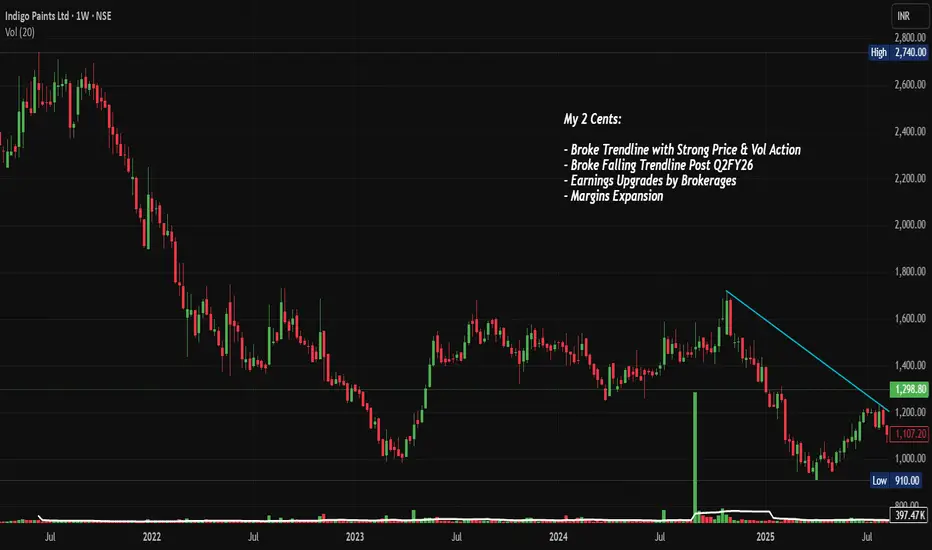
Price Action Analysis:
Historical Price Movement:
- The stock experienced a steep downtrend from its all-time high of approximately ₹2,695 in early 2022, declining over 60% to a low of ₹910 by mid-2024
- A prolonged bear market spanning nearly two years created a massive consolidation zone between ₹1,000 and ₹1,600 during 2023-2024
- Recent price action shows a strong bullish candle in November 2024, breaking above the downward trendline with significant momentum
- The current price of ₹1,298.80 represents a sharp recovery from the lows, gaining approximately ₹294.70, or 29.35%, in the recent move
Trendline Analysis:
- A clear falling trendline (marked in cyan on the chart) connected the lower highs from the 2022 peak through mid-2024
- This trendline acted as dynamic resistance, rejecting multiple rally attempts throughout 2023 and early 2024
- The recent breakout above this multi-year trendline occurred with strong price and volume confirmation, suggesting a potential trend reversal
- The breakout candle shows conviction with a decisive close above the trendline resistance
Price Structure:
- The stock formed a descending triangle pattern from 2022 to 2024, with lower highs and relatively flat lows around ₹900-₹1,000
- Post-Q2FY26 results (released in early November 2024), the stock has shown explosive upside momentum
- The recent surge created a bullish engulfing pattern on the weekly timeframe, signaling strong buyer interest
Volume Spread Analysis:
Volume Trends:
- Volume during the downtrend was relatively subdued, indicating lack of aggressive selling pressure
- The recent breakout candle shows significantly elevated volume at 7.67 million shares, representing 587.73 thousand volume units
- This volume spike confirms genuine buying interest and institutional participation in the breakout
- Volume expansion during the rally validates the authenticity of the price move
Volume-Price Relationship:
- The correlation between rising prices and expanding volume suggests healthy accumulation
- Previous attempts to break the trendline failed due to insufficient volume support
- Current volume levels are approximately 3-4x the average, indicating strong conviction among market participants
Key Technical Levels:
Support Levels:
- Primary Support (S1): ₹1,200—This represents the previous resistance zone that should now act as support
- Secondary Support (S2): ₹1,100 - The breakout point from the falling trendline
- Major Support (S3): ₹1,000-₹1,006 - Strong psychological level and previous consolidation base
- Ultimate Support (S4): ₹910 - The 52-week low acts as the ultimate floor
Resistance Levels:
- Immediate Resistance (R1): ₹1,400 - Near-term psychological barrier
- Intermediate Resistance (R2): ₹1,600 - Previous consolidation zone highs from 2023-2024
- Major Resistance (R3): ₹1,800 - Key supply zone from the downtrend phase
- Long-term Resistance (R4): ₹2,200-₹2,400 - Retracement levels toward the all-time high
Base Formation:
- A solid base has been established between ₹900 and ₹900-₹1,100 over an extended 18-month period
- This accumulation zone represents significant institutional buying at lower levels
- The base demonstrates strong hands holding the stock, reducing downside volatility
- Multiple tests of the ₹900-₹1,000 zone without breaking down confirms strong demand
Technical Patterns:
Reversal Patterns:
- A falling wedge/descending triangle pattern formed from 2022 to 2024, which is typically a bullish reversal pattern
- The pattern shows lower highs with relatively consistent lows, indicating selling exhaustion
- A breakout from this multi-year pattern suggests a major trend change is underway
Candlestick Patterns:
- The recent weekly candle shows strong bullish characteristics with a large body and minimal upper shadow
- The candle closed near its high, indicating buyer dominance throughout the period
- Previous candles show a transition from consolidation to expansion phase
Fundamental Backdrop:
Company Overview:
- Indigo Paints is India's fourth-largest decorative paints company with strong brand recognition
- The company operates three manufacturing facilities located in Jodhpur, Kochi, and Pudukkottai
- Headquartered in Pune, Maharashtra, the company was founded in 2000 and listed on stock exchanges in 2021
- Known for innovative product launches and being first-to-market with several differentiated paint solutions
Recent Financial Performance:
- Q2FY26 revenue grew 3.45% year-on-year to ₹298 Cr., though net income grew 5.85% to ₹26 Cr, due to competitive pressures
- Gross margins expanded to 45.1% from 44.1% in the previous year, driven by softening raw material costs and premium product focus
- EBITDA margin improved to 15.3% from 14.8%, reflecting operational efficiency gains
- The company has expanded its dealer network to over 18,900 active dealers and more than 11,650 tinting machines
Growth Catalysts:
- Management expects double-digit volume growth by Q4FY25, supported by strong leading indicators like dealer fund inflows and painter token scanning
- Extended monsoon impacted August sales, but July and September showed robust growth momentum
- The company is focusing on premium product mix to defend margins against aggressive competition from new entrants
- Expansion into project sales and construction chemicals segments provides new revenue streams
Sectoral Outlook:
Indian Paint Industry Overview:
- The Indian paints and coatings market is estimated at USD 10.46 billion in 2025 and expected to reach USD 16.38 billion by 2030, growing at 9.38% CAGR
- Architectural applications account for 77.56% of market demand in 2024, driven by India's construction boom
- The decorative segment accounts for nearly 75% of total demand, with 80% coming from repainting activity
- Repainting cycles have shortened from 7-8 years to just 4-5 years, accelerating demand growth
Competitive Landscape:
- New players like Birla Opus, JSW Paints, and Pidilite have entered with aggressive strategies and significant capital expenditure
- Birla Opus alone plans to increase industry capacity by 40% over the next three years, aiming to become the second-largest manufacturer by 2025
- Revenue growth slowed to 4% in FY24 after 14-15% CAGR between FY19 and FY23 due to price cuts and competitive pressures
- Despite margin pressure, established players like Indigo maintain advantage through distribution networks and brand loyalty
Industry Drivers:
- Residential unit sales surged 30% year-on-year to 474,000 units in 2024, supported by PM Awas Yojana affordable housing scheme
- The government plans to construct 30 million affordable houses over the next five years through PM Awas Yojana
- Rising disposable incomes, urbanization, and lifestyle changes are compressing repaint intervals in major cities
- Infrastructure projects under Bharatmala and Sagarmala are driving demand for industrial and protective coatings
Bull Case:
- A technical breakout from multi-year falling trendline with strong volume confirmation suggests major trend reversal
- Established player with differentiated product portfolio and strong gross margins outperforming peers
- Sector tailwinds from government infrastructure push and housing demand provide multi-year growth runway
- Valuation correction of 60% from peak creates attractive entry point for long-term wealth creation
- Management's focus on premium products and margin expansion positions company well against competition
Bear Case:
- Intense competition from well-capitalized new entrants (JSW, Birla Opus) could pressure market share
- Slower-than-expected volume growth in Q2FY26 raises concerns about demand momentum
- Margins vulnerable to aggressive pricing by competitors offering trade discounts
- An elongated monsoon and macroeconomic uncertainties could impact near-term performance
- Stock has rallied sharply in short period, creating potential for profit-booking
Key Monitoring Points:
- Track quarterly volume growth trajectory to confirm management's guidance of double-digit growth by Q4
- Monitor gross margin trends to ensure premium strategy is working despite competitive intensity
- Watch dealer expansion metrics and market share data versus new entrants
- Observe raw material price trends, particularly crude-linked derivatives impacting costs
- Follow infrastructure spending and housing sales data as leading indicators for industry demand
My 2 Cents:
- The stock has decisively broken out from a multi-Week falling trendline resistance with exceptional volume support
- Multiple technical factors align favorably: pattern breakout, volume confirmation, base formation, and momentum shift
- Risk-reward ratio remains attractive even after the recent rally, particularly on any pullback to ₹1,200 levels
- The base formation between ₹900 and ₹900-₹1,100 provides strong downside support for long-term holders
- While near-term earnings growth is muted due to competition, the long-term sector outlook remains robust
- The company's focus on operational efficiency and margin expansion is yielding results despite challenges
INDIGOPNTS presents a compelling asymmetric risk-reward opportunity where the technical setup, fundamental improvement trajectory, and sectoral tailwinds are aligning after a prolonged correction. The breakout from a multi-year base with strong volume support provides a high-conviction entry point for wealth creation over the next 12-24 months.
Full Coverage on my Newsletter this Week
Keep in the Watchlist and DOYR.
NO RECO. For Buy/Sell.
📌Thank you for exploring my idea! I hope you found it valuable.
🙏FOLLOW for more
👍BOOST if you found it useful.
✍️COMMENT below with your views.
Meanwhile, check out my other stock ideas on the right side until this trade is activated. I would love your feedback.
As per the Latest SEBI Mandate, this isn't a Trading/Investment RECOMMENDATION nor for Educational Purposes; it is just for Informational purposes only. The chart data used is 3 Months old, as Showing Live Chart Data is not allowed according to the New SEBI Mandate.
Disclaimer: "I am not a SEBI REGISTERED RESEARCH ANALYST AND INVESTMENT ADVISER."
This analysis is intended solely for informational purposes and should not be interpreted as financial advice. It is advisable to consult a qualified financial advisor or conduct thorough research before making investment decisions.
Price Action Analysis:
Historical Price Movement:
- The stock experienced a steep downtrend from its all-time high of approximately ₹2,695 in early 2022, declining over 60% to a low of ₹910 by mid-2024
- A prolonged bear market spanning nearly two years created a massive consolidation zone between ₹1,000 and ₹1,600 during 2023-2024
- Recent price action shows a strong bullish candle in November 2024, breaking above the downward trendline with significant momentum
- The current price of ₹1,298.80 represents a sharp recovery from the lows, gaining approximately ₹294.70, or 29.35%, in the recent move
Trendline Analysis:
- A clear falling trendline (marked in cyan on the chart) connected the lower highs from the 2022 peak through mid-2024
- This trendline acted as dynamic resistance, rejecting multiple rally attempts throughout 2023 and early 2024
- The recent breakout above this multi-year trendline occurred with strong price and volume confirmation, suggesting a potential trend reversal
- The breakout candle shows conviction with a decisive close above the trendline resistance
Price Structure:
- The stock formed a descending triangle pattern from 2022 to 2024, with lower highs and relatively flat lows around ₹900-₹1,000
- Post-Q2FY26 results (released in early November 2024), the stock has shown explosive upside momentum
- The recent surge created a bullish engulfing pattern on the weekly timeframe, signaling strong buyer interest
Volume Spread Analysis:
Volume Trends:
- Volume during the downtrend was relatively subdued, indicating lack of aggressive selling pressure
- The recent breakout candle shows significantly elevated volume at 7.67 million shares, representing 587.73 thousand volume units
- This volume spike confirms genuine buying interest and institutional participation in the breakout
- Volume expansion during the rally validates the authenticity of the price move
Volume-Price Relationship:
- The correlation between rising prices and expanding volume suggests healthy accumulation
- Previous attempts to break the trendline failed due to insufficient volume support
- Current volume levels are approximately 3-4x the average, indicating strong conviction among market participants
Key Technical Levels:
Support Levels:
- Primary Support (S1): ₹1,200—This represents the previous resistance zone that should now act as support
- Secondary Support (S2): ₹1,100 - The breakout point from the falling trendline
- Major Support (S3): ₹1,000-₹1,006 - Strong psychological level and previous consolidation base
- Ultimate Support (S4): ₹910 - The 52-week low acts as the ultimate floor
Resistance Levels:
- Immediate Resistance (R1): ₹1,400 - Near-term psychological barrier
- Intermediate Resistance (R2): ₹1,600 - Previous consolidation zone highs from 2023-2024
- Major Resistance (R3): ₹1,800 - Key supply zone from the downtrend phase
- Long-term Resistance (R4): ₹2,200-₹2,400 - Retracement levels toward the all-time high
Base Formation:
- A solid base has been established between ₹900 and ₹900-₹1,100 over an extended 18-month period
- This accumulation zone represents significant institutional buying at lower levels
- The base demonstrates strong hands holding the stock, reducing downside volatility
- Multiple tests of the ₹900-₹1,000 zone without breaking down confirms strong demand
Technical Patterns:
Reversal Patterns:
- A falling wedge/descending triangle pattern formed from 2022 to 2024, which is typically a bullish reversal pattern
- The pattern shows lower highs with relatively consistent lows, indicating selling exhaustion
- A breakout from this multi-year pattern suggests a major trend change is underway
Candlestick Patterns:
- The recent weekly candle shows strong bullish characteristics with a large body and minimal upper shadow
- The candle closed near its high, indicating buyer dominance throughout the period
- Previous candles show a transition from consolidation to expansion phase
Fundamental Backdrop:
Company Overview:
- Indigo Paints is India's fourth-largest decorative paints company with strong brand recognition
- The company operates three manufacturing facilities located in Jodhpur, Kochi, and Pudukkottai
- Headquartered in Pune, Maharashtra, the company was founded in 2000 and listed on stock exchanges in 2021
- Known for innovative product launches and being first-to-market with several differentiated paint solutions
Recent Financial Performance:
- Q2FY26 revenue grew 3.45% year-on-year to ₹298 Cr., though net income grew 5.85% to ₹26 Cr, due to competitive pressures
- Gross margins expanded to 45.1% from 44.1% in the previous year, driven by softening raw material costs and premium product focus
- EBITDA margin improved to 15.3% from 14.8%, reflecting operational efficiency gains
- The company has expanded its dealer network to over 18,900 active dealers and more than 11,650 tinting machines
Growth Catalysts:
- Management expects double-digit volume growth by Q4FY25, supported by strong leading indicators like dealer fund inflows and painter token scanning
- Extended monsoon impacted August sales, but July and September showed robust growth momentum
- The company is focusing on premium product mix to defend margins against aggressive competition from new entrants
- Expansion into project sales and construction chemicals segments provides new revenue streams
Sectoral Outlook:
Indian Paint Industry Overview:
- The Indian paints and coatings market is estimated at USD 10.46 billion in 2025 and expected to reach USD 16.38 billion by 2030, growing at 9.38% CAGR
- Architectural applications account for 77.56% of market demand in 2024, driven by India's construction boom
- The decorative segment accounts for nearly 75% of total demand, with 80% coming from repainting activity
- Repainting cycles have shortened from 7-8 years to just 4-5 years, accelerating demand growth
Competitive Landscape:
- New players like Birla Opus, JSW Paints, and Pidilite have entered with aggressive strategies and significant capital expenditure
- Birla Opus alone plans to increase industry capacity by 40% over the next three years, aiming to become the second-largest manufacturer by 2025
- Revenue growth slowed to 4% in FY24 after 14-15% CAGR between FY19 and FY23 due to price cuts and competitive pressures
- Despite margin pressure, established players like Indigo maintain advantage through distribution networks and brand loyalty
Industry Drivers:
- Residential unit sales surged 30% year-on-year to 474,000 units in 2024, supported by PM Awas Yojana affordable housing scheme
- The government plans to construct 30 million affordable houses over the next five years through PM Awas Yojana
- Rising disposable incomes, urbanization, and lifestyle changes are compressing repaint intervals in major cities
- Infrastructure projects under Bharatmala and Sagarmala are driving demand for industrial and protective coatings
Bull Case:
- A technical breakout from multi-year falling trendline with strong volume confirmation suggests major trend reversal
- Established player with differentiated product portfolio and strong gross margins outperforming peers
- Sector tailwinds from government infrastructure push and housing demand provide multi-year growth runway
- Valuation correction of 60% from peak creates attractive entry point for long-term wealth creation
- Management's focus on premium products and margin expansion positions company well against competition
Bear Case:
- Intense competition from well-capitalized new entrants (JSW, Birla Opus) could pressure market share
- Slower-than-expected volume growth in Q2FY26 raises concerns about demand momentum
- Margins vulnerable to aggressive pricing by competitors offering trade discounts
- An elongated monsoon and macroeconomic uncertainties could impact near-term performance
- Stock has rallied sharply in short period, creating potential for profit-booking
Key Monitoring Points:
- Track quarterly volume growth trajectory to confirm management's guidance of double-digit growth by Q4
- Monitor gross margin trends to ensure premium strategy is working despite competitive intensity
- Watch dealer expansion metrics and market share data versus new entrants
- Observe raw material price trends, particularly crude-linked derivatives impacting costs
- Follow infrastructure spending and housing sales data as leading indicators for industry demand
My 2 Cents:
- The stock has decisively broken out from a multi-Week falling trendline resistance with exceptional volume support
- Multiple technical factors align favorably: pattern breakout, volume confirmation, base formation, and momentum shift
- Risk-reward ratio remains attractive even after the recent rally, particularly on any pullback to ₹1,200 levels
- The base formation between ₹900 and ₹900-₹1,100 provides strong downside support for long-term holders
- While near-term earnings growth is muted due to competition, the long-term sector outlook remains robust
- The company's focus on operational efficiency and margin expansion is yielding results despite challenges
Full Coverage on my Newsletter this Week
Keep in the Watchlist and DOYR.
NO RECO. For Buy/Sell.
📌Thank you for exploring my idea! I hope you found it valuable.
🙏FOLLOW for more
👍BOOST if you found it useful.
✍️COMMENT below with your views.
Meanwhile, check out my other stock ideas on the right side until this trade is activated. I would love your feedback.
As per the Latest SEBI Mandate, this isn't a Trading/Investment RECOMMENDATION nor for Educational Purposes; it is just for Informational purposes only. The chart data used is 3 Months old, as Showing Live Chart Data is not allowed according to the New SEBI Mandate.
Disclaimer: "I am not a SEBI REGISTERED RESEARCH ANALYST AND INVESTMENT ADVISER."
This analysis is intended solely for informational purposes and should not be interpreted as financial advice. It is advisable to consult a qualified financial advisor or conduct thorough research before making investment decisions.
פרסומים קשורים
כתב ויתור
המידע והפרסומים אינם מיועדים להיות, ואינם מהווים, ייעוץ או המלצה פיננסית, השקעתית, מסחרית או מכל סוג אחר המסופקת או מאושרת על ידי TradingView. קרא עוד ב־תנאי השימוש.
פרסומים קשורים
כתב ויתור
המידע והפרסומים אינם מיועדים להיות, ואינם מהווים, ייעוץ או המלצה פיננסית, השקעתית, מסחרית או מכל סוג אחר המסופקת או מאושרת על ידי TradingView. קרא עוד ב־תנאי השימוש.