📈
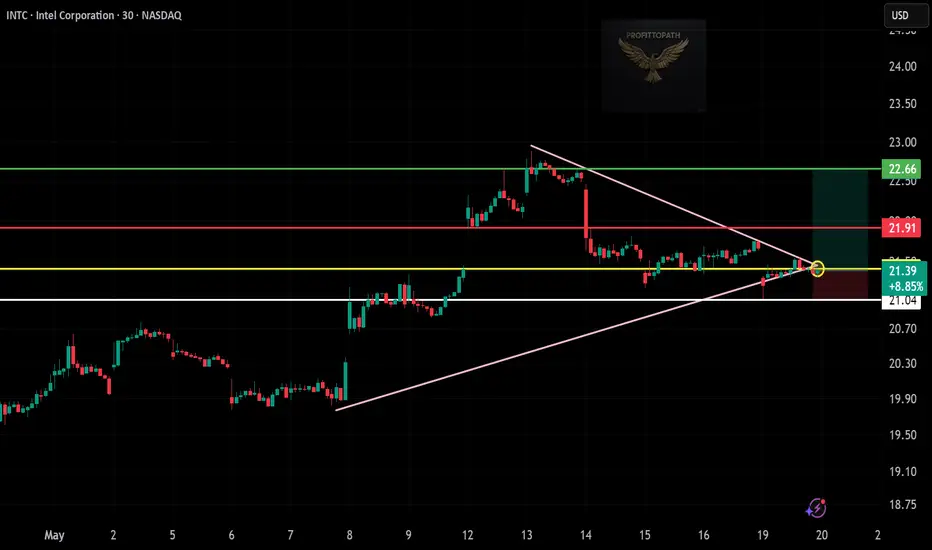
Current Price: $21.39
Pattern: Symmetrical triangle breakout (neutral-to-bullish bias)
Entry Zone: ~$21.39 (breakout confirmation)
Stop-Loss (SL): $21.04 (below triangle base/support)
Targets:
TP1: $21.91 (resistance – red line)
TP2: $22.66 (major resistance zone – green line)
🧠 Technical Highlights
Price has broken out of a tightening triangle pattern.
Yellow resistance flipped to support.
Volume not shown clearly but breakout candle shows good body.
Risk/Reward: Favorable at ~1:2 if targets hold.
🎯 Bias:
Bullish above $21.04.
Neutral or bearish below this zone.
כתב ויתור
המידע והפרסומים אינם מיועדים להיות, ואינם מהווים, ייעוץ או המלצה פיננסית, השקעתית, מסחרית או מכל סוג אחר המסופקת או מאושרת על ידי TradingView. קרא עוד ב־תנאי השימוש.
כתב ויתור
המידע והפרסומים אינם מיועדים להיות, ואינם מהווים, ייעוץ או המלצה פיננסית, השקעתית, מסחרית או מכל סוג אחר המסופקת או מאושרת על ידי TradingView. קרא עוד ב־תנאי השימוש.