The previous harmonic butterfly:
In this article I'll share with you how the price line of the IOTA coin has formed a very big harmonic pattern. Before this, I've already shared another major idea and that was a very big bullish butterfly which was formed on the weekly time frame chart. After taking bullish divergence from the potential reversal zone of this big bullish butterfly pattern, the Priceline surged to more than 1100%.

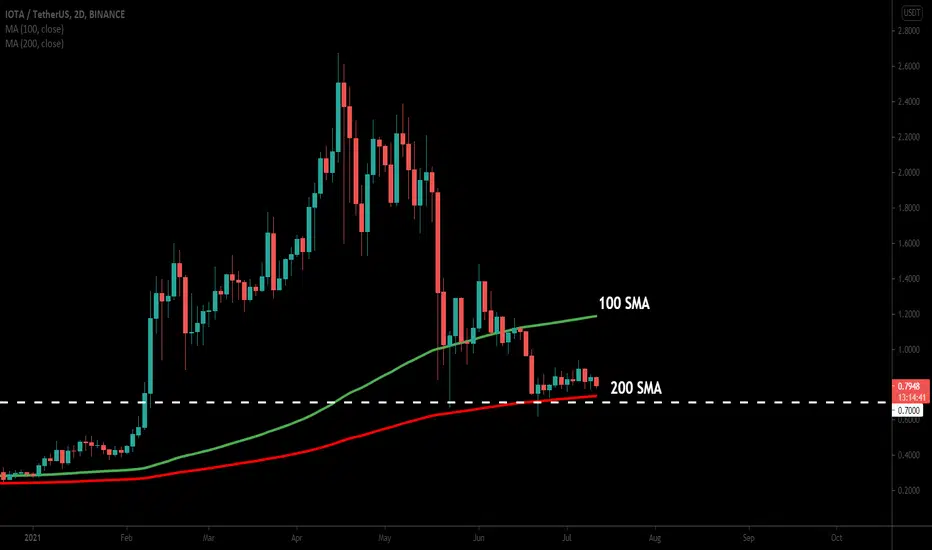
support resistance levels and SMAs:
After a very big rally, IOTA found strong resistance at $2.50 and after being rejected by this resistance level the price action moved down at the very strong support at $0.70. Now the price is moving at the $0.70 support level for the past several days. We also have very strong support of 200 simple moving average on the 2-day chart, which is exactly at the $0.70 support level. The next price level resistance is at $1.50 and then at $2.50. There is also a 100 simple moving average working as strong resistance before the $1.50 resistance level.

Big Cypher pattern:
Now this time on the weekly time frame chart, the price action of IOTA has formed another bullish Cypher pattern. After entering the buying zone the priceline has moved above the potential reversal zone and now agai re-entered the buying zone. The buy and sell targets according to Cypher can be as below:
Buy between: $0.8888 to $0.5214
Sell between: $1.17 to $1.87
The maximum extent of potential reversal zone $0.5214 can be used as stop loss. As per the above targets, this trade has a big profit possibility of 250%, and the big loss possibility is 41%.

In this article I'll share with you how the price line of the IOTA coin has formed a very big harmonic pattern. Before this, I've already shared another major idea and that was a very big bullish butterfly which was formed on the weekly time frame chart. After taking bullish divergence from the potential reversal zone of this big bullish butterfly pattern, the Priceline surged to more than 1100%.
support resistance levels and SMAs:
After a very big rally, IOTA found strong resistance at $2.50 and after being rejected by this resistance level the price action moved down at the very strong support at $0.70. Now the price is moving at the $0.70 support level for the past several days. We also have very strong support of 200 simple moving average on the 2-day chart, which is exactly at the $0.70 support level. The next price level resistance is at $1.50 and then at $2.50. There is also a 100 simple moving average working as strong resistance before the $1.50 resistance level.
Big Cypher pattern:
Now this time on the weekly time frame chart, the price action of IOTA has formed another bullish Cypher pattern. After entering the buying zone the priceline has moved above the potential reversal zone and now agai re-entered the buying zone. The buy and sell targets according to Cypher can be as below:
Buy between: $0.8888 to $0.5214
Sell between: $1.17 to $1.87
The maximum extent of potential reversal zone $0.5214 can be used as stop loss. As per the above targets, this trade has a big profit possibility of 250%, and the big loss possibility is 41%.
כתב ויתור
המידע והפרסומים אינם מיועדים להיות, ואינם מהווים, ייעוץ או המלצה פיננסית, השקעתית, מסחרית או מכל סוג אחר המסופקת או מאושרת על ידי TradingView. קרא עוד ב־תנאי השימוש.
כתב ויתור
המידע והפרסומים אינם מיועדים להיות, ואינם מהווים, ייעוץ או המלצה פיננסית, השקעתית, מסחרית או מכל סוג אחר המסופקת או מאושרת על ידי TradingView. קרא עוד ב־תנאי השימוש.