📊 1-Hour Timeframe: Support & Resistance Levels
Based on recent intraday data, here are the key support and resistance levels for IPCA Laboratories Ltd. on the 1-hour timeframe:
🔽 Support Levels:
S1: ₹1,324.36
S2: ₹1,323.13
S3: ₹1,322.06
🔼 Resistance Levels:
R1: ₹1,326.66
R2: ₹1,327.73
R3: ₹1,328.96
These levels are derived from standard pivot point calculations and are widely used by traders to identify potential reversal points.
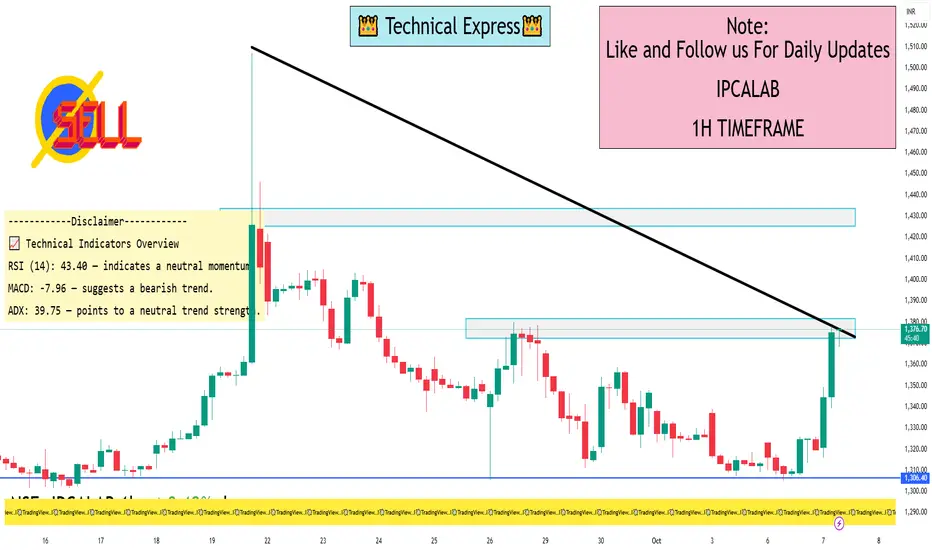
📈 Technical Indicators Overview
RSI (14): 43.40 — indicates a neutral momentum.
MACD: -7.96 — suggests a bearish trend.
ADX: 39.75 — points to a neutral trend strength.
Moving Averages:
5-period EMA: ₹1,325.64 — indicates a buy signal.
50-period EMA: ₹1,352.22 — suggests a sell signal.
200-period EMA: ₹1,351.26 — indicates a sell signal.
Pivot Points:
Pivot: ₹1,325.43
R1: ₹1,326.66
S1: ₹1,324.36
These indicators collectively suggest a cautious outlook for short-term traders, with a prevailing bearish sentiment.
Based on recent intraday data, here are the key support and resistance levels for IPCA Laboratories Ltd. on the 1-hour timeframe:
🔽 Support Levels:
S1: ₹1,324.36
S2: ₹1,323.13
S3: ₹1,322.06
🔼 Resistance Levels:
R1: ₹1,326.66
R2: ₹1,327.73
R3: ₹1,328.96
These levels are derived from standard pivot point calculations and are widely used by traders to identify potential reversal points.
📈 Technical Indicators Overview
RSI (14): 43.40 — indicates a neutral momentum.
MACD: -7.96 — suggests a bearish trend.
ADX: 39.75 — points to a neutral trend strength.
Moving Averages:
5-period EMA: ₹1,325.64 — indicates a buy signal.
50-period EMA: ₹1,352.22 — suggests a sell signal.
200-period EMA: ₹1,351.26 — indicates a sell signal.
Pivot Points:
Pivot: ₹1,325.43
R1: ₹1,326.66
S1: ₹1,324.36
These indicators collectively suggest a cautious outlook for short-term traders, with a prevailing bearish sentiment.
I built a Buy & Sell Signal Indicator with 85% accuracy.
📈 Get access via DM or
WhatsApp: wa.link/d997q0
Contact - +91 76782 40962
| Email: techncialexpress@gmail.com
| Script Coder | Trader | Investor | From India
📈 Get access via DM or
WhatsApp: wa.link/d997q0
Contact - +91 76782 40962
| Email: techncialexpress@gmail.com
| Script Coder | Trader | Investor | From India
פרסומים קשורים
כתב ויתור
המידע והפרסומים אינם אמורים להיות, ואינם מהווים, עצות פיננסיות, השקעות, מסחר או סוגים אחרים של עצות או המלצות שסופקו או מאושרים על ידי TradingView. קרא עוד בתנאים וההגבלות.