📈 1-Week Performance Snapshot
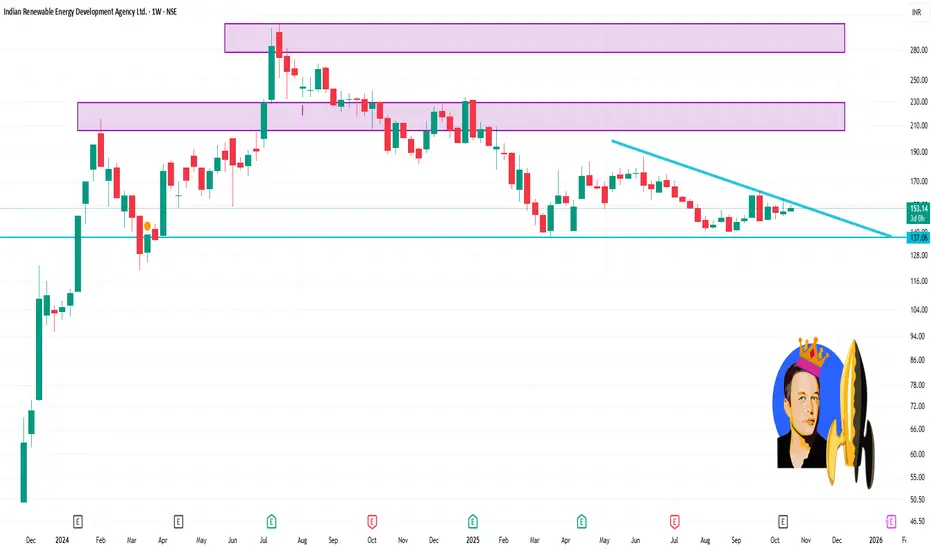
Current Price: ₹153.20
1-Week Change: Approximately +0.07%
1-Month Change: Approximately -1.92%
3-Month Change: Approximately -5.12%
1-Year Change: Approximately -30.65%
📊 Recent Trading Activity
October 20, 2025: Opened at ₹151.54, reached a high of ₹154.98, and closed at ₹153.42.
October 17, 2025: Opened at ₹153.00, reached a high of ₹153.38, and closed at ₹151.05.
October 15, 2025: Closed at ₹153.29 after reporting a net profit of ₹549.33 crore for Q2 FY26.
🔍 Technical Indicators
52-Week Range: ₹137.01 – ₹234.29
Market Capitalization: Approximately ₹43,079.56 crore
P/E Ratio: Approximately 23.49
Debt-to-Equity Ratio: Approximately 5.41
Dividend Yield: 0.00%
פרסומים קשורים
כתב ויתור
המידע והפרסומים אינם מיועדים להיות, ואינם מהווים, ייעוץ או המלצה פיננסית, השקעתית, מסחרית או מכל סוג אחר המסופקת או מאושרת על ידי TradingView. קרא עוד ב־תנאי השימוש.
פרסומים קשורים
כתב ויתור
המידע והפרסומים אינם מיועדים להיות, ואינם מהווים, ייעוץ או המלצה פיננסית, השקעתית, מסחרית או מכל סוג אחר המסופקת או מאושרת על ידי TradingView. קרא עוד ב־תנאי השימוש.