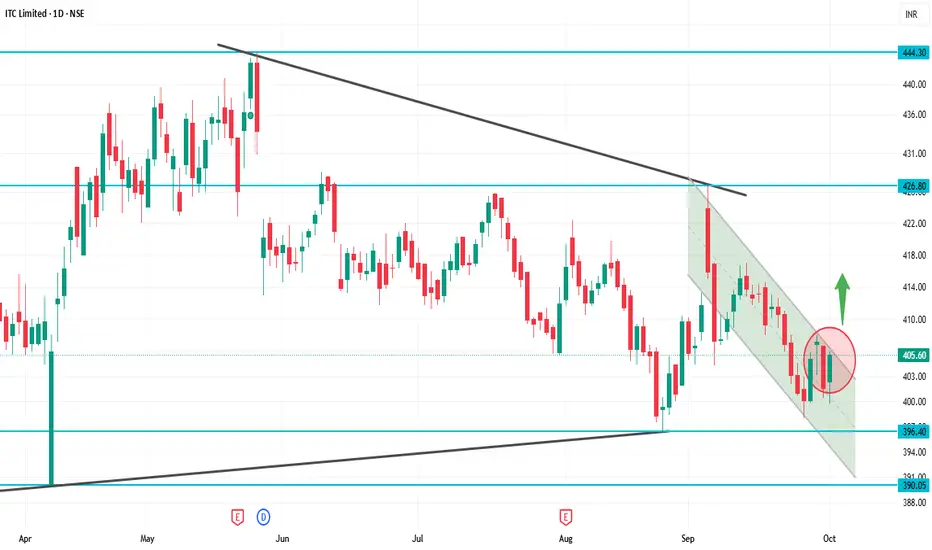
Current Price: ₹405.60
52-Week High: ₹524.35
52-Week Low: ₹390.15
Trend: Downward — trading below 5, 20, 50, 100, 200-day moving averages
Daily Chart Insights
Price below moving averages → bearish trend.
RSI & MACD → weak momentum, signaling short-term selling pressure.
Support zone at ₹390–₹400 → critical; a break below can push price down to ₹370–₹380.
Resistance at ₹420–₹430 → a strong close above may signal trend reversal.
Strategy / Outlook
Bearish Bias: Short-term trend is downward.
Buying Opportunity: Near support zones (₹390–₹400) if it holds.
Bullish Trigger: Close above ₹430 with strong volume indicates potential reversal.
Risk Management: Use stop-loss below critical support zones.
פרסומים קשורים
כתב ויתור
המידע והפרסומים אינם מיועדים להיות, ואינם מהווים, ייעוץ או המלצה פיננסית, השקעתית, מסחרית או מכל סוג אחר המסופקת או מאושרת על ידי TradingView. קרא עוד ב־תנאי השימוש.
פרסומים קשורים
כתב ויתור
המידע והפרסומים אינם מיועדים להיות, ואינם מהווים, ייעוץ או המלצה פיננסית, השקעתית, מסחרית או מכל סוג אחר המסופקת או מאושרת על ידי TradingView. קרא עוד ב־תנאי השימוש.