📊 Updated Snapshot
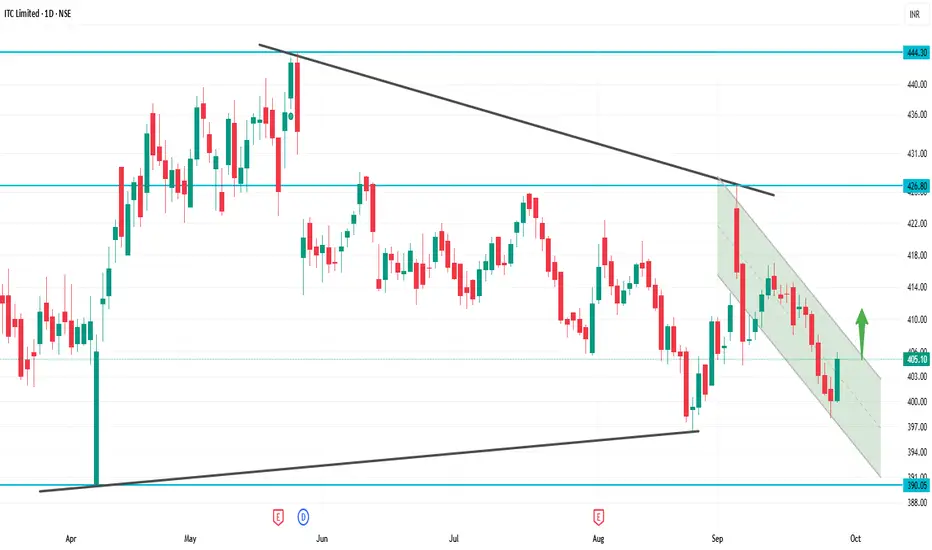
Current Price: ~₹405
Day Range: ₹402 – ₹410
52-Week High: ₹499
52-Week Low: ₹399
📈 Technical Outlook
Support Zones:
Strong support at ₹405 (current zone)
Next support at ₹398
Resistance Zones:
Immediate resistance at ₹410–₹416
Next resistance at ₹421
Trend Bias: Weak bearish → stock is near 52-week low, testing crucial support.
📌 Step-by-Step View
If it holds above ₹405–₹398: Buyers may step in, possible bounce toward ₹416–₹421.
If it breaks below ₹398: More downside risk opens, weakness can extend further.
Upside revival only above ₹421 closing: That will change trend toward bullish.
פרסומים קשורים
כתב ויתור
המידע והפרסומים אינם מיועדים להיות, ואינם מהווים, ייעוץ או המלצה פיננסית, השקעתית, מסחרית או מכל סוג אחר המסופקת או מאושרת על ידי TradingView. קרא עוד ב־תנאי השימוש.
פרסומים קשורים
כתב ויתור
המידע והפרסומים אינם מיועדים להיות, ואינם מהווים, ייעוץ או המלצה פיננסית, השקעתית, מסחרית או מכל סוג אחר המסופקת או מאושרת על ידי TradingView. קרא עוד ב־תנאי השימוש.