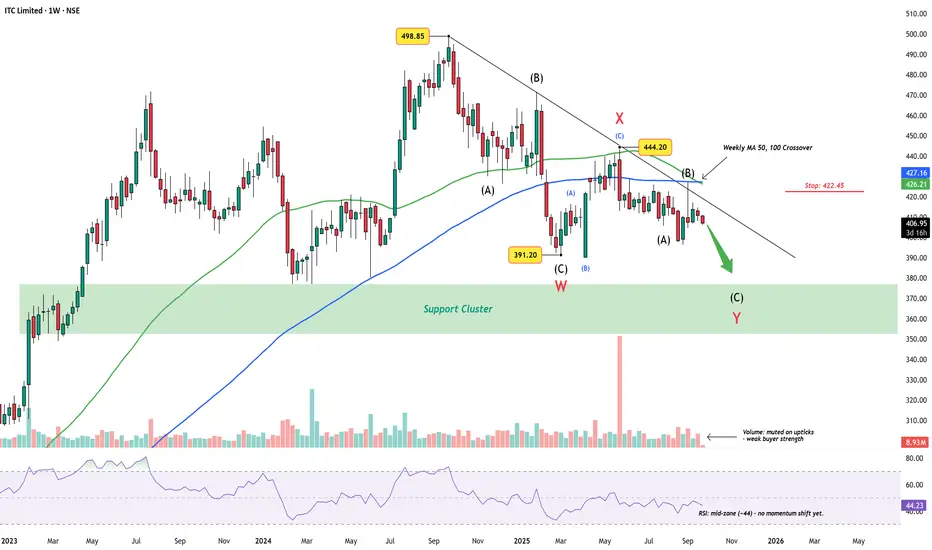
ITC has been trending lower since the ₹498.85 peak, carving out what appears to be a complex W-X-Y correction. The first leg (W) found support near ₹391.20, followed by a corrective bounce into X at ₹444.20. The decline since then has kept price under a descending trendline, respecting the larger corrective rhythm.
Wave Count
The broader structure hints that ITC may continue toward the support cluster (₹350–375) before this correction runs its course.
Indicators
Invalidation
A decisive break above ₹422.45 and sustained strength beyond 427 would question this bearish view, hinting at a possible shift back to bullish sequences.
Summary
Unless ITC reclaims higher ground above 422.45, the bias stays toward a Wave Y completion in the support cluster zone.
Disclaimer: This analysis is for educational purposes only and does not constitute investment advice. Please do your own research (DYOR) before making any trading decisions.
Wave Count
- Wave W: Completed into the ₹391.20 low.
- Wave X: Counter-trend rally capped at 444.20.
- Wave Y: Now unfolding, with sub-wave (C) still incomplete.
The broader structure hints that ITC may continue toward the support cluster (₹350–375) before this correction runs its course.
Indicators
- Volume: Muted on upticks – rallies lack buying strength.
- RSI (~44): Mid-zone, leaving space for further downside before oversold conditions.
- Weekly 50/100 MA crossover: Adds weight to the ongoing corrective bias.
Invalidation
A decisive break above ₹422.45 and sustained strength beyond 427 would question this bearish view, hinting at a possible shift back to bullish sequences.
Summary
Unless ITC reclaims higher ground above 422.45, the bias stays toward a Wave Y completion in the support cluster zone.
Disclaimer: This analysis is for educational purposes only and does not constitute investment advice. Please do your own research (DYOR) before making any trading decisions.
WaveXplorer | Elliott Wave insights
📊 X profile: @veerappa89
📊 X profile: @veerappa89
פרסומים קשורים
כתב ויתור
המידע והפרסומים אינם מיועדים להיות, ואינם מהווים, ייעוץ או המלצה פיננסית, השקעתית, מסחרית או מכל סוג אחר המסופקת או מאושרת על ידי TradingView. קרא עוד ב־תנאי השימוש.
WaveXplorer | Elliott Wave insights
📊 X profile: @veerappa89
📊 X profile: @veerappa89
פרסומים קשורים
כתב ויתור
המידע והפרסומים אינם מיועדים להיות, ואינם מהווים, ייעוץ או המלצה פיננסית, השקעתית, מסחרית או מכל סוג אחר המסופקת או מאושרת על ידי TradingView. קרא עוד ב־תנאי השימוש.