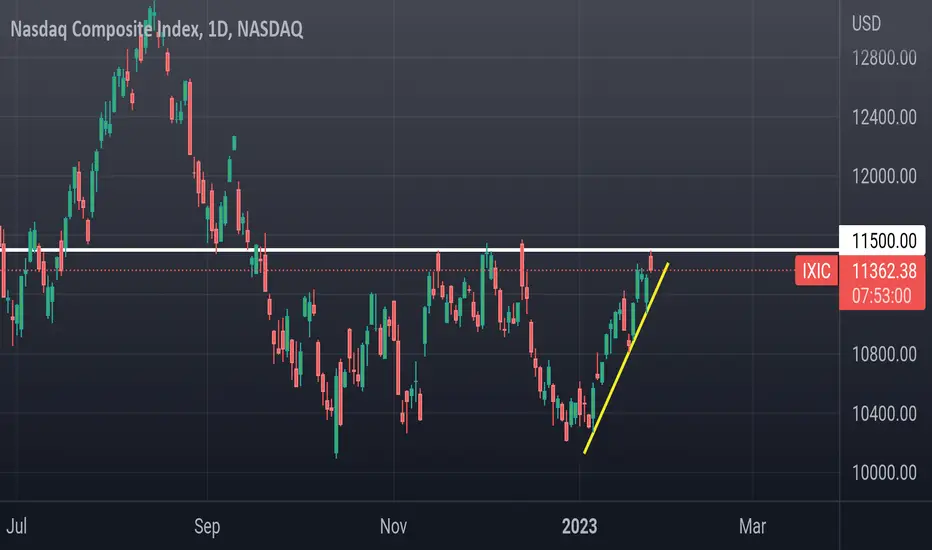
I usually do QQQ charts which only follows 100 non Financials .
This Nasdaq composite charts cover 3700 . Also this is the ticker you see when you watch CNBC!
11,500 has been resistance since last Sept and has been an area of strong price action dating back to fall of 2020.
Also now in this area is QQQ Daily 200sma which Nasdaq has traded under for most of 2022..
If we break over 11500 and hold after fed meeting next week then there is a high chance we close gap at 13k. If things go south and we break yellow uptrend then we revisit 10k
כתב ויתור
המידע והפרסומים אינם אמורים להיות, ואינם מהווים, עצות פיננסיות, השקעות, מסחר או סוגים אחרים של עצות או המלצות שסופקו או מאושרים על ידי TradingView. קרא עוד בתנאים וההגבלות.
כתב ויתור
המידע והפרסומים אינם אמורים להיות, ואינם מהווים, עצות פיננסיות, השקעות, מסחר או סוגים אחרים של עצות או המלצות שסופקו או מאושרים על ידי TradingView. קרא עוד בתנאים וההגבלות.