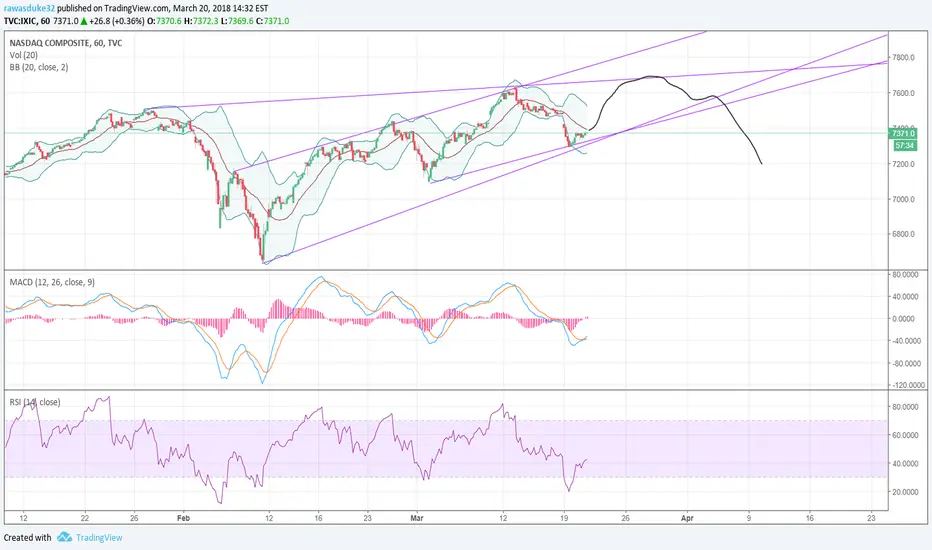
On the H1 the MACD and RSI are looking nice and bull. Chart just bounced of support and possibly headed up to resistance at 7680ish. The daily chart is showing the macd beginning to cross downwards, which could bring a correction in the near future. After the first week of April were getting close to the pinch point of the wedge. It could still break up, but we're also moving in a ascending channel, which typically breaks downwards.
כתב ויתור
המידע והפרסומים אינם אמורים להיות, ואינם מהווים, עצות פיננסיות, השקעות, מסחר או סוגים אחרים של עצות או המלצות שסופקו או מאושרים על ידי TradingView. קרא עוד בתנאים וההגבלות.
כתב ויתור
המידע והפרסומים אינם אמורים להיות, ואינם מהווים, עצות פיננסיות, השקעות, מסחר או סוגים אחרים של עצות או המלצות שסופקו או מאושרים על ידי TradingView. קרא עוד בתנאים וההגבלות.