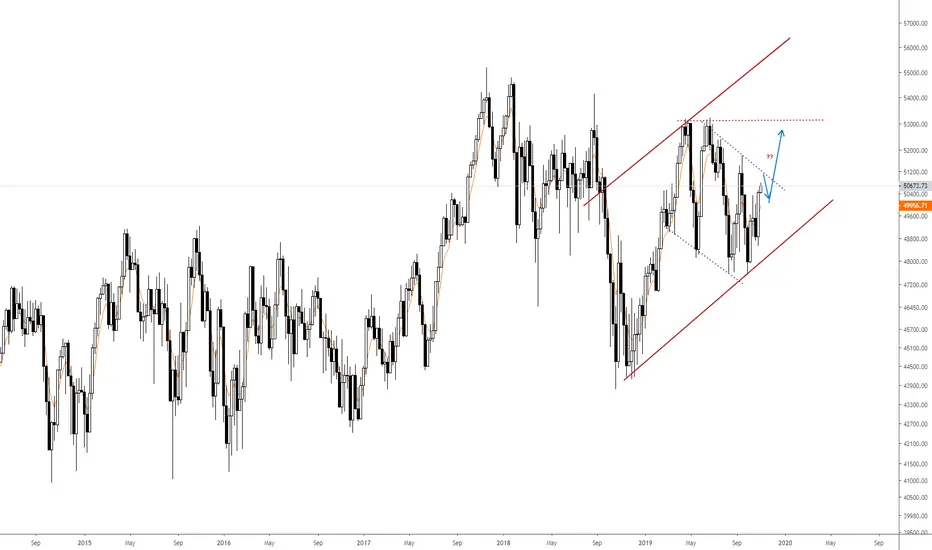
The weekly J200 top 40 index chart is still trading in a shorter term down trend channel that began during may 2019 up until now.
However the bigger uptrend is still intact from the lows of October 2018 And I would suspect that if we get a strong weekly close above 51500 it should open up room to move to 53200
However the bigger uptrend is still intact from the lows of October 2018 And I would suspect that if we get a strong weekly close above 51500 it should open up room to move to 53200
כתב ויתור
המידע והפרסומים אינם מיועדים להיות, ואינם מהווים, ייעוץ או המלצה פיננסית, השקעתית, מסחרית או מכל סוג אחר המסופקת או מאושרת על ידי TradingView. קרא עוד ב־תנאי השימוש.
כתב ויתור
המידע והפרסומים אינם מיועדים להיות, ואינם מהווים, ייעוץ או המלצה פיננסית, השקעתית, מסחרית או מכל סוג אחר המסופקת או מאושרת על ידי TradingView. קרא עוד ב־תנאי השימוש.