JSE General Retail Index vs JSE All Share Index - Price & Memory
JSE General Retailers vs JSE All Share Index
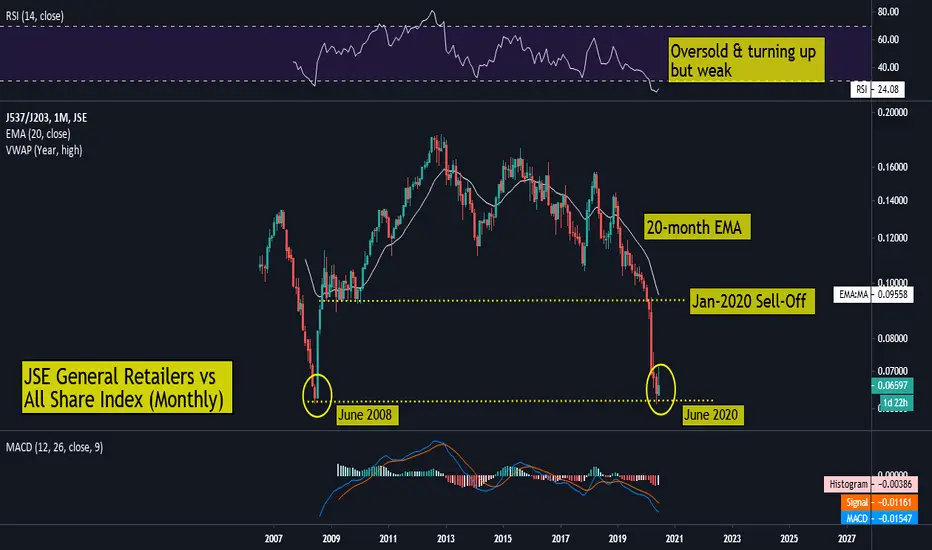
It's been a torrid two years for the JSE General Retail sector as it battles an extremely tough economic backdrop which includes high unemployment and an ever-waning consumer confidence. It also never helped that these stocks were 'priced for perfection' with the price-to-earnings ratios often in the mid-20s to early-30s. As the Rand started to losing significant ground, and the economic realities started to hit home, many of these names started to unravel as earnings and revenue growth slowed dramatically, leading to share prices and valuations unwinding as market participants began to discount the fiercely competitive environment. On the chart, it's once again proven why prices have memory and key level should not be ignored. During January 2020, as Covid-19 started to make the mainstream news, we saw the price on the Relative/Ratio chart lose key support which was held from November 2008 to February 2010. This hard break resulted in the price making a sharp decline which saw the price go on to test the June 2008 lows - from which we saw a bounce (JSE Retailers then out-performing the broader market). The current candle structure has seen some selling pressure, possibly reflective of the waning of 'SA Inc' shares versus the overall market. Whilst this long term level offers temporary support, it should be noted that a breakdown is possible, which would signal the continued under-performance of the General Retail Index versus the All Share Index. In terms of the technical indicators, long term momentum remains down with the RSI in oversold and turning up but in weak territory and the MACD below the zero bound. One possible glimmer of hope for this relative chart is the price being extended well below the 20-month exponential moving average, which often acts as a magnet when it is extended too far from the price.
It's been a torrid two years for the JSE General Retail sector as it battles an extremely tough economic backdrop which includes high unemployment and an ever-waning consumer confidence. It also never helped that these stocks were 'priced for perfection' with the price-to-earnings ratios often in the mid-20s to early-30s. As the Rand started to losing significant ground, and the economic realities started to hit home, many of these names started to unravel as earnings and revenue growth slowed dramatically, leading to share prices and valuations unwinding as market participants began to discount the fiercely competitive environment. On the chart, it's once again proven why prices have memory and key level should not be ignored. During January 2020, as Covid-19 started to make the mainstream news, we saw the price on the Relative/Ratio chart lose key support which was held from November 2008 to February 2010. This hard break resulted in the price making a sharp decline which saw the price go on to test the June 2008 lows - from which we saw a bounce (JSE Retailers then out-performing the broader market). The current candle structure has seen some selling pressure, possibly reflective of the waning of 'SA Inc' shares versus the overall market. Whilst this long term level offers temporary support, it should be noted that a breakdown is possible, which would signal the continued under-performance of the General Retail Index versus the All Share Index. In terms of the technical indicators, long term momentum remains down with the RSI in oversold and turning up but in weak territory and the MACD below the zero bound. One possible glimmer of hope for this relative chart is the price being extended well below the 20-month exponential moving average, which often acts as a magnet when it is extended too far from the price.
כתב ויתור
המידע והפרסומים אינם מיועדים להיות, ואינם מהווים, ייעוץ או המלצה פיננסית, השקעתית, מסחרית או מכל סוג אחר המסופקת או מאושרת על ידי TradingView. קרא עוד ב־תנאי השימוש.
כתב ויתור
המידע והפרסומים אינם מיועדים להיות, ואינם מהווים, ייעוץ או המלצה פיננסית, השקעתית, מסחרית או מכל סוג אחר המסופקת או מאושרת על ידי TradingView. קרא עוד ב־תנאי השימוש.