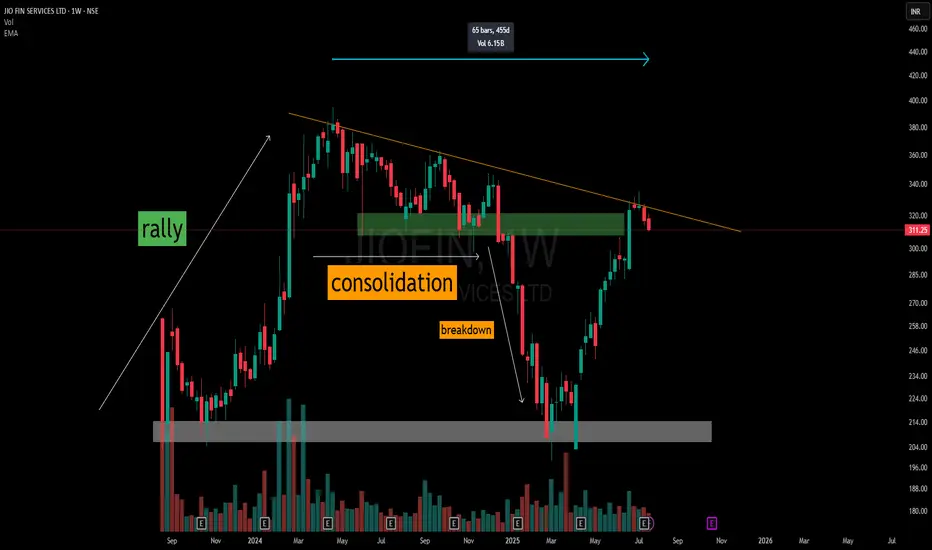
This weekly chart of Jio Fin Services Ltd illustrates a multi-phase price structure over 455 days:
🔹 Initial Rally — Kicks off from a defined accumulation base (grey zone), marking the start of a strong impulse leg.
🔹 Consolidation Phase — Price enters a descending triangle formation just below a historical resistance band.
🔹 Breakdown — Clean breakdown from the triangle pattern sends price sharply downward.
🔹 V-Shaped Recovery — A strong reaction off the original base zone leads to a sharp reversal.
🔹 Back to the 455-Day Counter Trendline — Price now tests the long-standing counter trendline, which has remained intact throughout.
📌 This chart demonstrates how historical price structures—especially well-defined base formations and trendline resistances—continue to act as critical reference points for future price action.
🛠️ No predictions here. Just a structured breakdown of price behavior and major decision zones traders are often drawn to.
🎯 Master My Self-Made Trading Strategy
📈 Telegram (Learn Today): t.me/hashtaghammer
✅ WhatsApp (Learn Today): wa.me/919455664601
📈 Telegram (Learn Today): t.me/hashtaghammer
✅ WhatsApp (Learn Today): wa.me/919455664601
פרסומים קשורים
כתב ויתור
המידע והפרסומים אינם מיועדים להיות, ואינם מהווים, ייעוץ או המלצה פיננסית, השקעתית, מסחרית או מכל סוג אחר המסופקת או מאושרת על ידי TradingView. קרא עוד ב־תנאי השימוש.