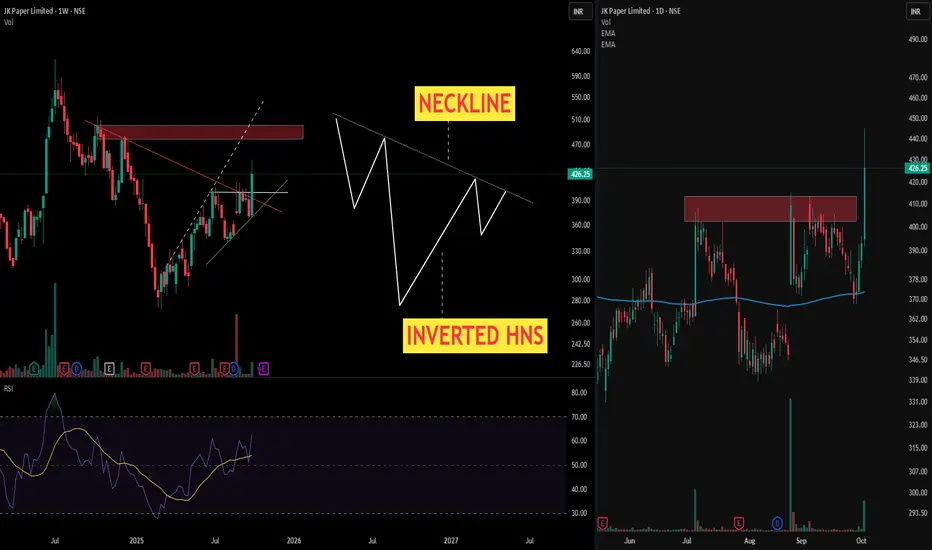
> Chart presents a textbook Inverted Head and Shoulders pattern on the weekly timeframe—one of the most reliable bullish reversal formations in technical analysis. This sophisticated pattern structure demonstrates the gradual shift from bearish exhaustion to bullish momentum, offering astute traders a high-probability setup.
> Anatomical Breakdown of the Pattern
- Left Shoulder: Initial decline to approximately ₹280 levels, followed by a relief rally—representing the first phase of selling pressure exhaustion
- Head: The decisive low zone forming the deepest trough—marking the capitulation point where maximum bearish sentiment peaks
- Right Shoulder: Higher low formation, demonstrating diminishing selling pressure and emerging buying interest
- Neckline: The critical resistance zone connecting the intermediate highs—serving as the pattern's confirmation level
> The Right side chart showcase the Daily time frame movement forclear outlook on Multi time frame basis .
Disclaimer: Technical analysis provides probability-based insights. Always implement proper risk management and consider multiple timeframe confirmations before executing trades.
🎯 Master My Self-Made Trading Strategy
📈 Telegram (Learn Today): t.me/hashtaghammer
✅ WhatsApp (Learn Today): wa.me/919455664601
📈 Telegram (Learn Today): t.me/hashtaghammer
✅ WhatsApp (Learn Today): wa.me/919455664601
פרסומים קשורים
כתב ויתור
המידע והפרסומים אינם מיועדים להיות, ואינם מהווים, ייעוץ או המלצה פיננסית, השקעתית, מסחרית או מכל סוג אחר המסופקת או מאושרת על ידי TradingView. קרא עוד ב־תנאי השימוש.