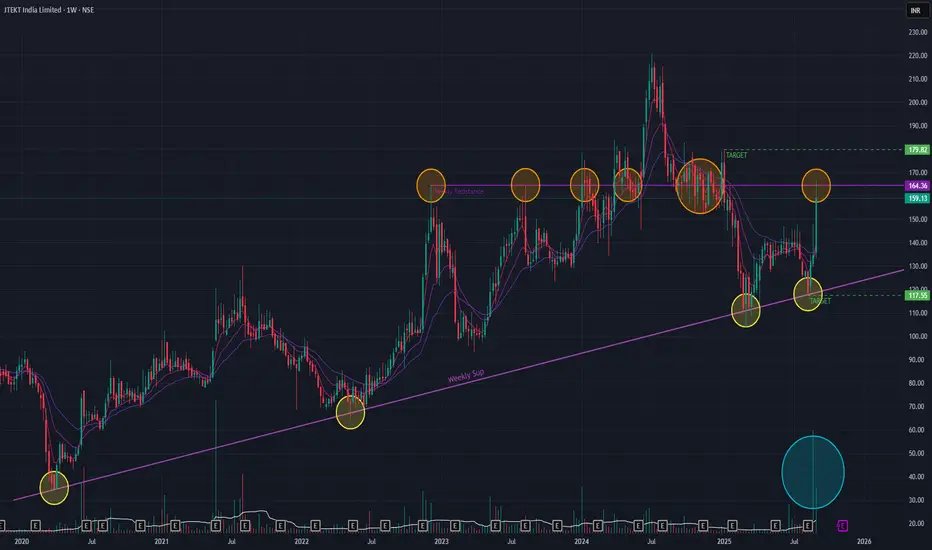
JTEKT is on an uptrend and have been respecting the support trendline as indicated. Since Dec 2022, the stock made several attempts to BreakOut of a major resistance zone and was successful once in Breaking Out and making an All Time High (ATH) in Jun 2024. As of last week the stock surged by 18+ % with huge volume. During this process the short-term EMAs did a positive cross-over. All of these are bullish signals.
During the coming week, if the stock is able to showcase bullish price-action then the stock may reach 179 levels. In a profit booking scenario, we may see the stock go down to 117 levels.
Keep watching for next week's price-action.
During the coming week, if the stock is able to showcase bullish price-action then the stock may reach 179 levels. In a profit booking scenario, we may see the stock go down to 117 levels.
Keep watching for next week's price-action.
Disclaimer: This analysis is my personal view & for educational purposes only. They shall not be construed as trade or investment advice. Before making any financial decision, it is imperative that you consult with a qualified financial professional.
כתב ויתור
המידע והפרסומים אינם אמורים להיות, ואינם מהווים, עצות פיננסיות, השקעות, מסחר או סוגים אחרים של עצות או המלצות שסופקו או מאושרים על ידי TradingView. קרא עוד בתנאים וההגבלות.