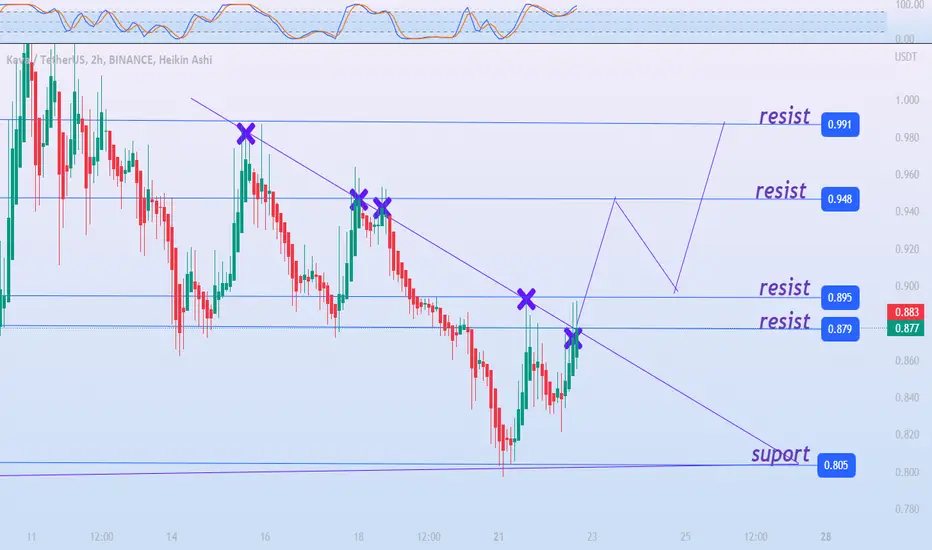
The above graph of Kava (KAVA) shows a triangle pattern. This pattern is being broken as the graph shows. The oversold indicated by the RSI may push the price of KAVA towards 0.852. It follows its supports and resistances.
Supports: 0.852 / 0.805
Resistances: 0.895 / 0.948 / 0.991
Supports: 0.852 / 0.805
Resistances: 0.895 / 0.948 / 0.991
כתב ויתור
המידע והפרסומים אינם אמורים להיות, ואינם מהווים, עצות פיננסיות, השקעות, מסחר או סוגים אחרים של עצות או המלצות שסופקו או מאושרים על ידי TradingView. קרא עוד בתנאים וההגבלות.
כתב ויתור
המידע והפרסומים אינם אמורים להיות, ואינם מהווים, עצות פיננסיות, השקעות, מסחר או סוגים אחרים של עצות או המלצות שסופקו או מאושרים על ידי TradingView. קרא עוד בתנאים וההגבלות.