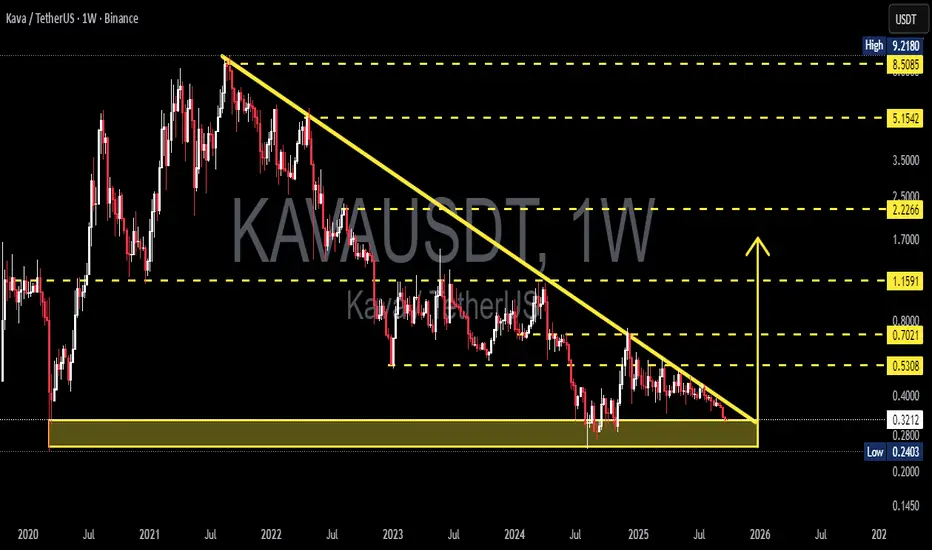
KAVA is currently standing at a critical crossroads. After a prolonged downtrend from its all-time high, the price is now consolidating inside a descending triangle on the weekly timeframe. Lower highs keep pressing the price downward, while the historical support zone at $0.24 – $0.32 is still holding as the last line of defense.
The triangle is getting tighter (apex approaching), which often signals an imminent big move — either a bullish reversal or a bearish continuation.
---
🔎 Pattern Analysis
Main pattern: Descending Triangle
→ Traditionally seen as a bearish continuation, but if the support holds strong, it could act as a springboard for a major reversal.
Historical support: $0.24 – $0.32 (yellow box), a make-or-break area before entering uncharted lower territory.
Falling trendline: The multi-year descending line from 2021 remains the key resistance that bulls must reclaim.
---
🚀 Bullish Scenario
1. Breakout confirmation → A weekly close above the descending trendline.
2. Stronger signal → Break + retest above $0.53.
3. Upside targets:
$0.70 → first psychological barrier.
$1.16 → strong historical resistance.
$2.22 → mid-term breakout target.
4. Extra signals: Rising volume + RSI recovery from oversold would strengthen bullish momentum.
---
🐻 Bearish Scenario
1. Breakdown confirmation → A weekly close below $0.24 with strong volume.
2. Downside targets:
Below $0.24 → opens room for deeper lows.
Sustained breakdown would confirm the continuation of the multi-year bearish trend.
3. Risk factor: Watch for potential false breakdowns (bear traps) if price quickly reclaims the support.
---
🎯 Conclusion
$0.24 – $0.32 is KAVA’s do-or-die zone.
Holding this level → chances of a major reversal.
Losing this level → the bearish trend extends even further.
KAVA is in its final stage of accumulation or distribution. Traders should wait for clear breakout confirmation before committing, as volatility is likely to expand once price exits this structure.
---
KAVA/USDT is consolidating at historical support $0.24 – $0.32, trapped inside a descending triangle. The apex is near → a decisive move is coming.
Bullish case: Breakout above the trendline and $0.53 → targets $0.70 – $1.16 – $2.22.
Bearish case: Breakdown below $0.24 → opens the door for deeper lows.
This is a multi-year turning point for KAVA. Patience for confirmation could reward traders with the next major move.
---
#KAVA #KAVAUSDT #Crypto #Altcoins #PriceAction #DescendingTriangle #SupportResistance #CryptoAnalysis #BreakoutTrading
✅ Get Free Signals! Join Our Telegram Channel Here: t.me/TheCryptoNuclear
✅ Twitter: twitter.com/crypto_nuclear
✅ Join Bybit : partner.bybit.com/b/nuclearvip
✅ Benefits : Lifetime Trading Fee Discount -50%
✅ Twitter: twitter.com/crypto_nuclear
✅ Join Bybit : partner.bybit.com/b/nuclearvip
✅ Benefits : Lifetime Trading Fee Discount -50%
כתב ויתור
המידע והפרסומים אינם מיועדים להיות, ואינם מהווים, ייעוץ או המלצה פיננסית, השקעתית, מסחרית או מכל סוג אחר המסופקת או מאושרת על ידי TradingView. קרא עוד ב־תנאי השימוש.