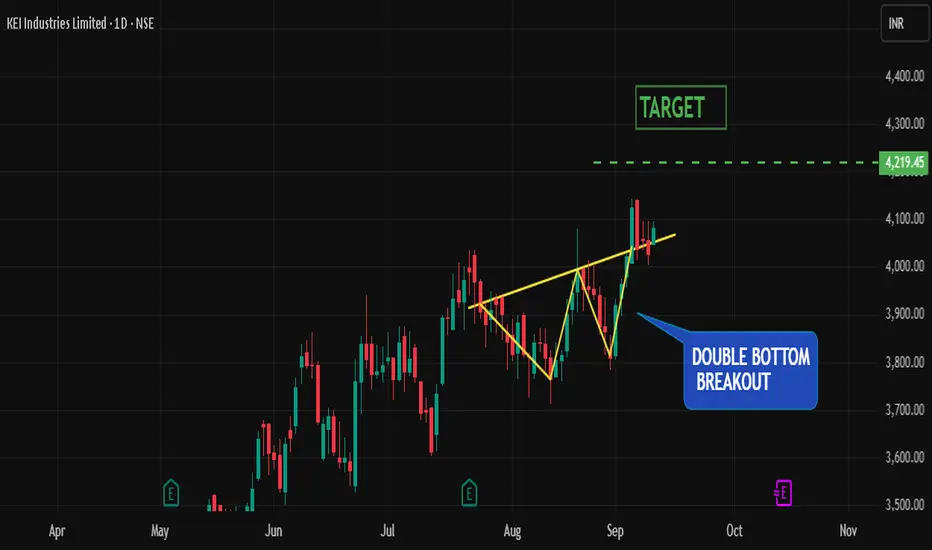
The stock has recently completed a double-bottom reversal pattern. A double bottom forms when price tests the same support level twice and fails to break lower, creating a “W-shaped” structure. This indicates that sellers tried twice to push the stock lower but were unable to, while buyers stepped in to defend the level. Once price breaks above the neckline (the midpoint of the “W”), the pattern is confirmed, often signaling the start of a bullish trend.
Adding further strength to this setup, price is holding firmly above the 50D, 100D, and 200D SMA. Here’s why this matters:

50-Day SMA: Represents short-term trend. Interestingly, the stock has now tested the 50D SMA thrice and held each time, showing strong buyer interest and reinforcing bullish momentum.
100-Day SMA: Reflects medium-term structure; price above this confirms that buyers dominate the broader swing.
200-Day SMA: The long-term benchmark; trading above this signals the stock is firmly in an uptrend.
When price stays above all three moving averages, it shows alignment across short, medium, and long-term trends — a powerful confirmation that bulls are in control.
Trade Plan:
Entry: On breakout above neckline or on a pullback retest of neckline as support.
Target: ₹4219 (measured move objective from the double bottom pattern).
Risk Management: Stick to disciplined sizing; risk no more than 1–2% of trading capital.
Adding further strength to this setup, price is holding firmly above the 50D, 100D, and 200D SMA. Here’s why this matters:
50-Day SMA: Represents short-term trend. Interestingly, the stock has now tested the 50D SMA thrice and held each time, showing strong buyer interest and reinforcing bullish momentum.
100-Day SMA: Reflects medium-term structure; price above this confirms that buyers dominate the broader swing.
200-Day SMA: The long-term benchmark; trading above this signals the stock is firmly in an uptrend.
When price stays above all three moving averages, it shows alignment across short, medium, and long-term trends — a powerful confirmation that bulls are in control.
Trade Plan:
Entry: On breakout above neckline or on a pullback retest of neckline as support.
Target: ₹4219 (measured move objective from the double bottom pattern).
Risk Management: Stick to disciplined sizing; risk no more than 1–2% of trading capital.
My Social Media links :
📥 Instagram - instagram.com/sagar_trademaster/
📥 Youtube - youtube.com/@TruthfulTrader
📥 Instagram - instagram.com/sagar_trademaster/
📥 Youtube - youtube.com/@TruthfulTrader
כתב ויתור
המידע והפרסומים אינם מיועדים להיות, ואינם מהווים, ייעוץ או המלצה פיננסית, השקעתית, מסחרית או מכל סוג אחר המסופקת או מאושרת על ידי TradingView. קרא עוד ב־תנאי השימוש.