📊 1-Day Technical Summary
Current Price: ₹2,030.50
Open: ₹1,998.00
High: ₹2,084.40
Low: ₹1,954.70
Close: ₹2,030.50
Volume: 177,664 shares
VWAP: ₹2,029.19
Price Change: -0.67%
🔍 Technical Indicators
RSI (14-day): 39.91 — Indicates a bearish trend, approaching oversold conditions
MACD: -16.34 — Suggests a bearish momentum
Moving Averages: All short-term and long-term moving averages (MA5 to MA200) are signaling a Strong Sell
Stochastic RSI: In a bearish zone, reinforcing the downward momentum
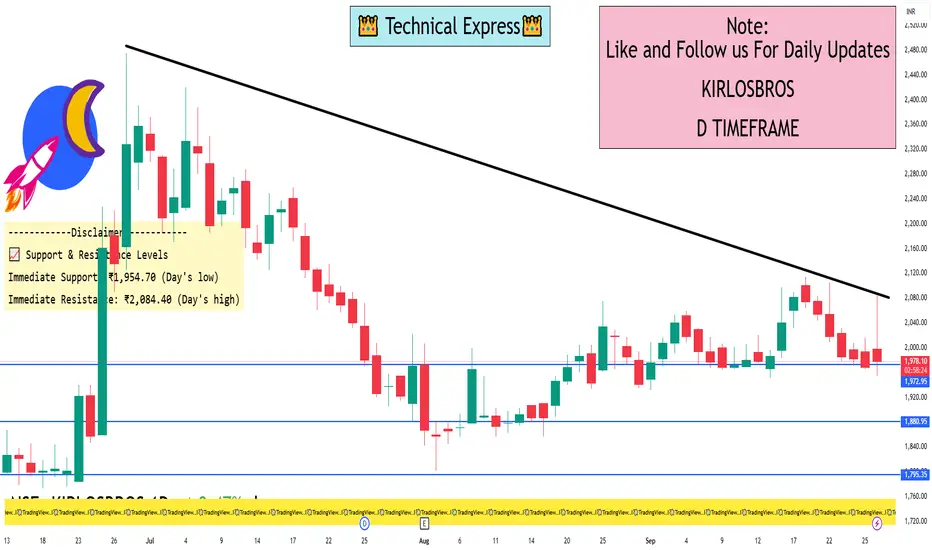
📈 Support & Resistance Levels
Immediate Support: ₹1,954.70 (Day's low)
Immediate Resistance: ₹2,084.40 (Day's high)
⚠️ Conclusion
The 1-day technical indicators for Kirloskar Brothers Ltd. suggest a bearish outlook, with the stock trading below key moving averages and exhibiting negative momentum. Traders should exercise caution and consider waiting for a confirmation of trend reversal before initiating long positions.
Current Price: ₹2,030.50
Open: ₹1,998.00
High: ₹2,084.40
Low: ₹1,954.70
Close: ₹2,030.50
Volume: 177,664 shares
VWAP: ₹2,029.19
Price Change: -0.67%
🔍 Technical Indicators
RSI (14-day): 39.91 — Indicates a bearish trend, approaching oversold conditions
MACD: -16.34 — Suggests a bearish momentum
Moving Averages: All short-term and long-term moving averages (MA5 to MA200) are signaling a Strong Sell
Stochastic RSI: In a bearish zone, reinforcing the downward momentum
📈 Support & Resistance Levels
Immediate Support: ₹1,954.70 (Day's low)
Immediate Resistance: ₹2,084.40 (Day's high)
⚠️ Conclusion
The 1-day technical indicators for Kirloskar Brothers Ltd. suggest a bearish outlook, with the stock trading below key moving averages and exhibiting negative momentum. Traders should exercise caution and consider waiting for a confirmation of trend reversal before initiating long positions.
I built a Buy & Sell Signal Indicator with 85% accuracy.
📈 Get access via DM or
WhatsApp: wa.link/d997q0
Contact - +91 76782 40962
| Email: techncialexpress@gmail.com
| Script Coder | Trader | Investor | From India
📈 Get access via DM or
WhatsApp: wa.link/d997q0
Contact - +91 76782 40962
| Email: techncialexpress@gmail.com
| Script Coder | Trader | Investor | From India
פרסומים קשורים
כתב ויתור
המידע והפרסומים אינם מיועדים להיות, ואינם מהווים, ייעוץ או המלצה פיננסית, השקעתית, מסחרית או מכל סוג אחר המסופקת או מאושרת על ידי TradingView. קרא עוד ב־תנאי השימוש.