📉 Latent View Analytics Ltd – Technical Setup (Daily Chart)
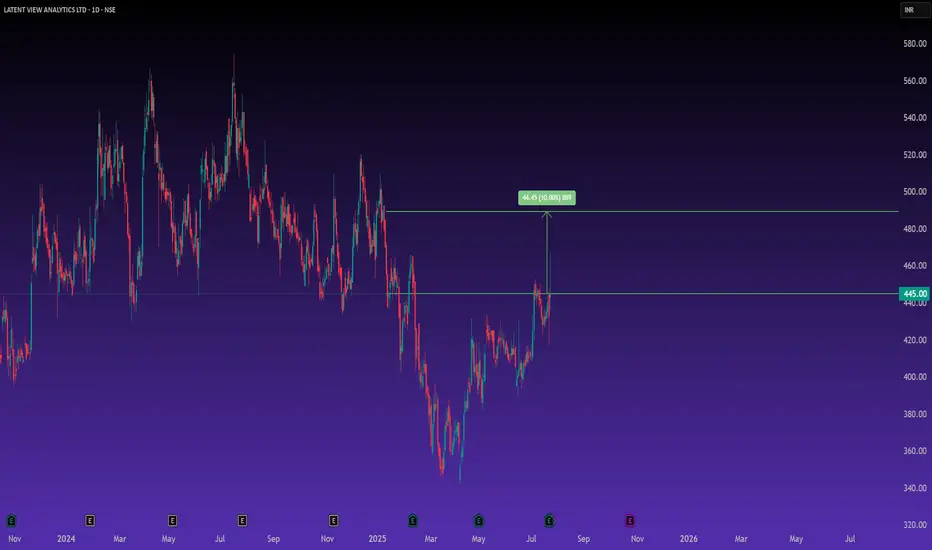
Latent View has shown a strong bullish reversal from its March–May 2025 lows and is currently trading at ₹445, with a sharp breakout attempt in recent sessions.
🔍 Chart Observations:
✅ Breakout Zone: Price has convincingly reclaimed the ₹445 zone, which acted as strong resistance in the past.
🎯 Upside Target: The next key resistance lies at ₹489, marking a ~10% potential upside from the current levels.
📈 Trend Shift: The stock has formed a higher low and a breakout candle, suggesting renewed buying interest post-earnings.
🔋 Volume Confirmation Needed: While price action is promising, sustained volumes will be key to confirm this breakout.
⚠️ What to Watch For:
If it sustains above ₹445, it could move quickly toward ₹489.
A close below ₹430 might invalidate this bullish setup in the short term.
📌 Conclusion: After a long consolidation and downtrend, Latent View is attempting a comeback. With strong earnings support and a bullish breakout in play, the stock could see further upside in the near term.
🧠 Chart + Fundamentals = Conviction Trade
כתב ויתור
המידע והפרסומים אינם אמורים להיות, ואינם מהווים, עצות פיננסיות, השקעות, מסחר או סוגים אחרים של עצות או המלצות שסופקו או מאושרים על ידי TradingView. קרא עוד בתנאים וההגבלות.
כתב ויתור
המידע והפרסומים אינם אמורים להיות, ואינם מהווים, עצות פיננסיות, השקעות, מסחר או סוגים אחרים של עצות או המלצות שסופקו או מאושרים על ידי TradingView. קרא עוד בתנאים וההגבלות.