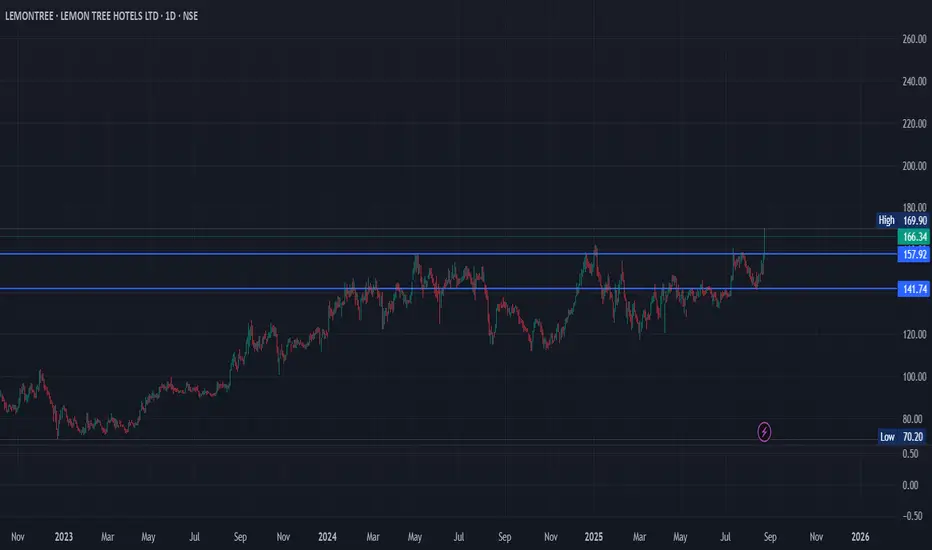
Chart Analysis (Daily Timeframe)
Current Price: ₹166.34 (up +6.92% today with strong volume ~15.5M).
Resistance Zones:
Around ₹157–160 → previously a strong resistance, now broken convincingly.
Next major resistance around ₹170–175 → stock is testing this zone now.
Support Zones:
Immediate support: ₹157.92 (recent breakout level).
Stronger support: ₹141.74 (old base).
Trend: The stock has been in a long consolidation (sideways) for almost a year and just gave a breakout with volume → this is usually a bullish sign.
🟢 Positives
Fresh breakout after long consolidation (a strong bullish pattern).
Volume is very high on the breakout → confirms buying interest.
Structure suggests possibility of a new uptrend if ₹157+ is sustained.
🔴 Risks
Price is near resistance zone (₹170–175). A pullback is possible.
If it falls back below ₹157 with volume, breakout may fail.
✅ Conclusion (Simple)
Good for buying if looking for swing/medium-term.
Ideal entry: On dips near ₹157–160 (with stop-loss below ₹141).
Upside targets: ₹180 → ₹200+ possible in coming months if momentum continues.
Stop-loss: ₹141 (below support).
👉 In short: Stock looks bullish after a long consolidation, but better to buy on dips near ₹157–160 rather than chasing at ₹166-170.
There is no any Buy/Sell recommendation, only for learning purpose as stock market is very risky
כתב ויתור
המידע והפרסומים אינם אמורים להיות, ואינם מהווים, עצות פיננסיות, השקעות, מסחר או סוגים אחרים של עצות או המלצות שסופקו או מאושרים על ידי TradingView. קרא עוד בתנאים וההגבלות.
כתב ויתור
המידע והפרסומים אינם אמורים להיות, ואינם מהווים, עצות פיננסיות, השקעות, מסחר או סוגים אחרים של עצות או המלצות שסופקו או מאושרים על ידי TradingView. קרא עוד בתנאים וההגבלות.
