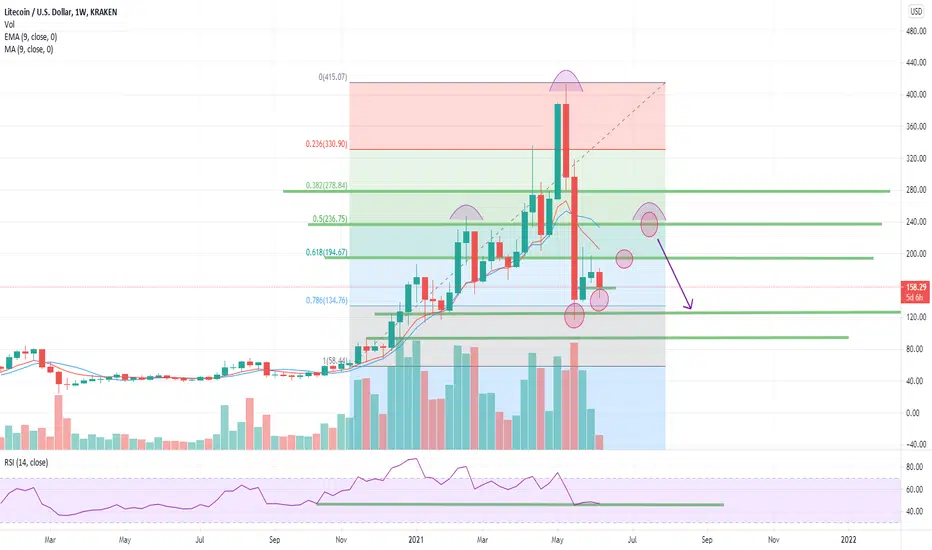
We continued to the downside, contrary to what I was expecting. So now we are looking at the weekly chart.
This is just another iteration of my previous ideas. This time, you can see the levels of resistance and support align with the fib levels. This retracement has gone deep into the gains of the last impulse. The Chart shows a potential for continued higher lows. The rsi is at 47 at time of post. If the shoulder is completed, I see a potential short opportunity coming.
This is not financial advice. This is for my reference and record as a hobby trader.
Related ideas linked.
פרסומים קשורים
כתב ויתור
המידע והפרסומים אינם מיועדים להיות, ואינם מהווים, ייעוץ או המלצה פיננסית, השקעתית, מסחרית או מכל סוג אחר המסופקת או מאושרת על ידי TradingView. קרא עוד ב־תנאי השימוש.
פרסומים קשורים
כתב ויתור
המידע והפרסומים אינם מיועדים להיות, ואינם מהווים, ייעוץ או המלצה פיננסית, השקעתית, מסחרית או מכל סוג אחר המסופקת או מאושרת על ידי TradingView. קרא עוד ב־תנאי השימוש.