Litecoin (LTC) technical analysis:
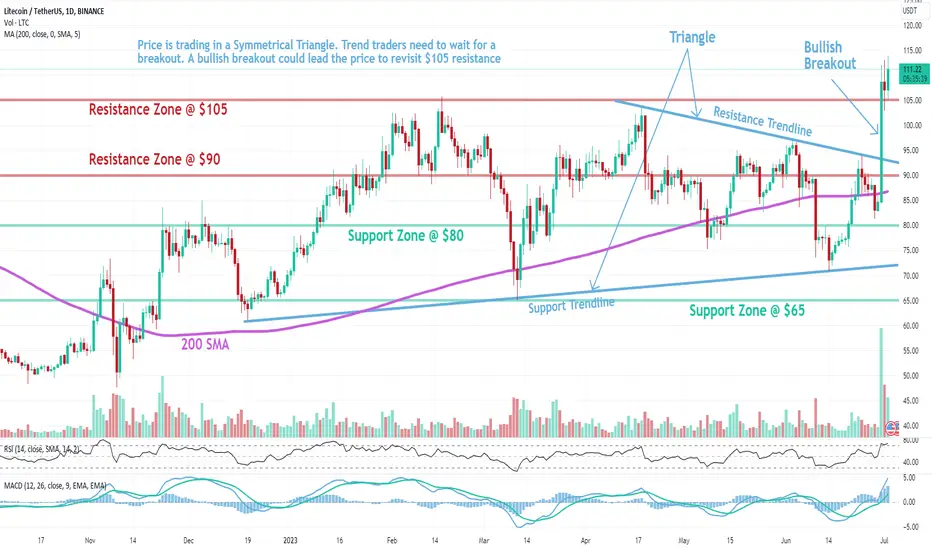
Trade setup: Price is trading in a Symmetrical Triangle. Trend traders need to wait for a breakout. A bullish breakout could lead the price to revisit $105 resistance
Pattern: Symmetrical Triangle, which is a neutral pattern, suggesting indecision in the market. Although it could break either up or down, it usually breaks in the direction of the prevailing trend (i.e. continuation not reversal).
Trend: Uptrend on Short-Term basis, Neutral on Medium-Term basis and Downtrend on Long-Term basis.
Momentum is Bullish (MACD Line is above MACD Signal Line and RSI is above 55).
Support and Resistance: Nearest Support Zone is $80, then $65. The nearest Resistance Zone is $90, which it broke then $105.
כתב ויתור
המידע והפרסומים אינם אמורים להיות, ואינם מהווים, עצות פיננסיות, השקעות, מסחר או סוגים אחרים של עצות או המלצות שסופקו או מאושרים על ידי TradingView. קרא עוד בתנאים וההגבלות.
כתב ויתור
המידע והפרסומים אינם אמורים להיות, ואינם מהווים, עצות פיננסיות, השקעות, מסחר או סוגים אחרים של עצות או המלצות שסופקו או מאושרים על ידי TradingView. קרא עוד בתנאים וההגבלות.