As I’ve mentioned in my recent videos, LYFT is one of my top 3 priority stocks for October — and for good reason.
The fundamentals have exploded while the price is still lagging far behind.
🔸 Fundamentals
EPS growth has been massive.
– In March, EPS was up +128% YoY,
– and by June, it jumped to +234% YoY.
EPS has finally moved into positive territory, which is a strong signal.
Revenue continues to rise steadily, and EPS literally took off while the price hasn’t followed yet.
To put it in perspective — when LYFT traded around $60, EPS was negative.
Now, EPS is many times higher, but the stock still trades far below those levels.
Even emission has stopped increasing (we saw –0.25% in June 2025), and the forward P/E is only 15.3,
which is extremely low for this kind of EPS acceleration.
→ In short: LYFT looks deeply undervalued from a fundamental standpoint.

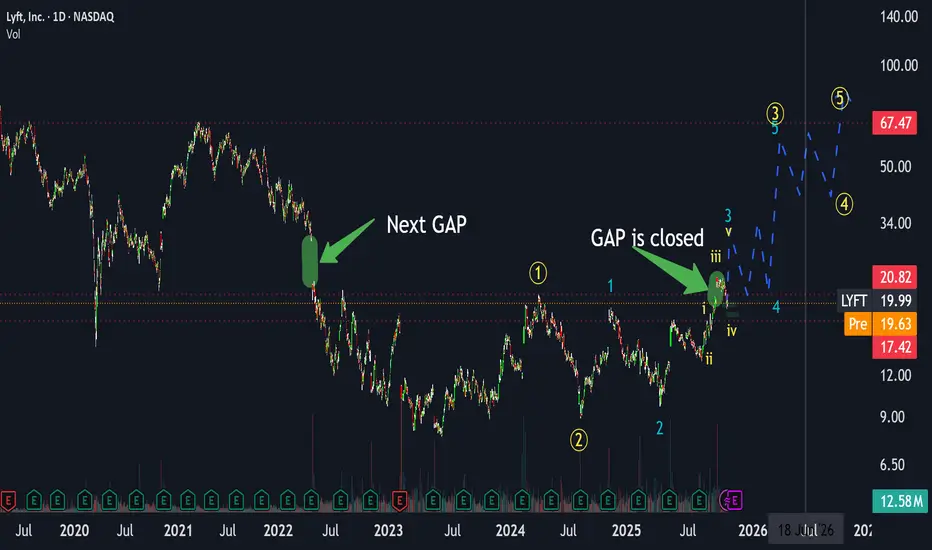
🔸 Technical Picture
Technically, LYFT has just closed a local gap, exactly as expected.
We are currently finishing the fourth sub-wave of the third global wave.
This means the fifth wave is coming next, and the current target around $70 represents only the peak of the third sub-wave — there is still additional upside expected beyond $70.
In the short term, we could see a retest around $18,
followed by the next major move — closing the May 2022 gap near $30, forming the third wave of this cycle.
After that, some consolidation is likely in the $20–30 range,
followed by the next impulse targeting $50–70.
This will be the fourth wave pullback, eventually leading into the fifth wave breakout above $70,
with potential for even higher upside as the global third wave continues.
Summary
Overall, LYFT shows a perfect mix of improving fundamentals and bullish technical structure.
As I’ve said in my latest videos, this stock could take off soon —
and it remains one of my Top 3 picks for October.
Call to Action
If you enjoy this type of analysis or would like me to review other tickers, tap on rocket 🚀 and leave a ticker in the comments.
I’ll make sure to cover your suggestions in upcoming posts soon!
(Full breakdown and context discussed in my recent videos — you can find them via my profile.)
The fundamentals have exploded while the price is still lagging far behind.
🔸 Fundamentals
EPS growth has been massive.
– In March, EPS was up +128% YoY,
– and by June, it jumped to +234% YoY.
EPS has finally moved into positive territory, which is a strong signal.
Revenue continues to rise steadily, and EPS literally took off while the price hasn’t followed yet.
To put it in perspective — when LYFT traded around $60, EPS was negative.
Now, EPS is many times higher, but the stock still trades far below those levels.
Even emission has stopped increasing (we saw –0.25% in June 2025), and the forward P/E is only 15.3,
which is extremely low for this kind of EPS acceleration.
→ In short: LYFT looks deeply undervalued from a fundamental standpoint.
🔸 Technical Picture
Technically, LYFT has just closed a local gap, exactly as expected.
We are currently finishing the fourth sub-wave of the third global wave.
This means the fifth wave is coming next, and the current target around $70 represents only the peak of the third sub-wave — there is still additional upside expected beyond $70.
In the short term, we could see a retest around $18,
followed by the next major move — closing the May 2022 gap near $30, forming the third wave of this cycle.
After that, some consolidation is likely in the $20–30 range,
followed by the next impulse targeting $50–70.
This will be the fourth wave pullback, eventually leading into the fifth wave breakout above $70,
with potential for even higher upside as the global third wave continues.
Summary
Overall, LYFT shows a perfect mix of improving fundamentals and bullish technical structure.
As I’ve said in my latest videos, this stock could take off soon —
and it remains one of my Top 3 picks for October.
Call to Action
If you enjoy this type of analysis or would like me to review other tickers, tap on rocket 🚀 and leave a ticker in the comments.
I’ll make sure to cover your suggestions in upcoming posts soon!
(Full breakdown and context discussed in my recent videos — you can find them via my profile.)
עסקה פעילה
Price action did not follow the extension scenario I initially expected for wave 3. Instead, the structure has evolved into a Running Flat, which suggests we are currently forming wave 4.In a Running Flat, wave B exceeds the previous high, which we have already seen, and now we should be completing the final wave C. Since this is a Running Flat, wave C will likely dip below wave A, but there is a key limitation here:
price must not break below 17.50.
A move under 17.50 would invalidate the entire structure.
For now, I am watching the 17.50 area closely. My expectation is that price may test the 200-day MA, currently around 18.20-18.30. A move into the 18 zone followed by a bounce would fit the Running Flat scenario.
As long as 17.50 holds, I still expect the next upward leg, potentially into the 30 area (give or take). But again, 17.50 is the critical level. Hold it -> bullish continuation. Break it -> structure invalid.
FREE Trading Hub
👉 sdk-trading.com/discord
Real-time entries, exits and Q&A. Clean mid–term & long–term analysis. Free to join.
More analysis / forecasts:
sdk-trading.com
👉 sdk-trading.com/discord
Real-time entries, exits and Q&A. Clean mid–term & long–term analysis. Free to join.
More analysis / forecasts:
sdk-trading.com
פרסומים קשורים
כתב ויתור
המידע והפרסומים אינם מיועדים להיות, ואינם מהווים, ייעוץ או המלצה פיננסית, השקעתית, מסחרית או מכל סוג אחר המסופקת או מאושרת על ידי TradingView. קרא עוד ב־תנאי השימוש.