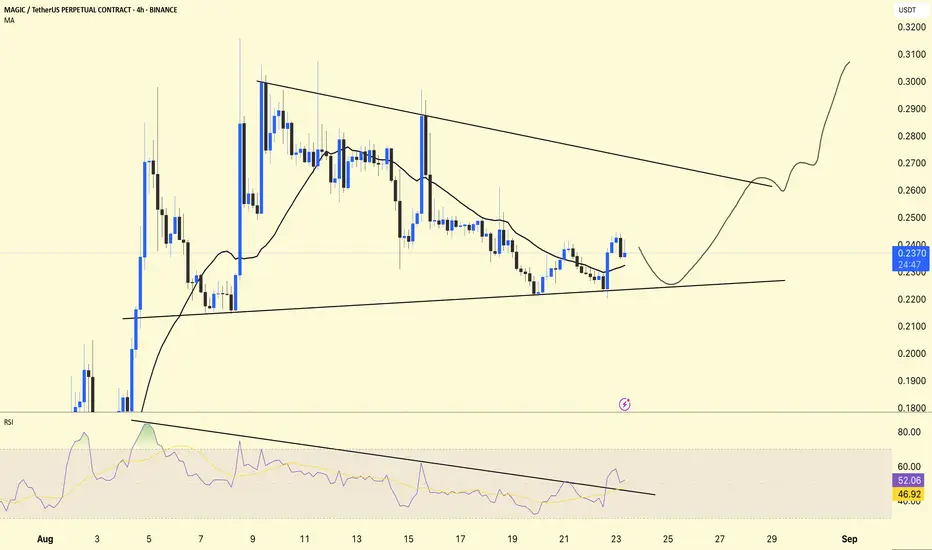
MAGIC is currently trading at $0.2376, showing a falling wedge structure with RSI breakout confirmation.
📊 Chart Overview:
Falling Wedge Pattern
The price is consolidating between a lower high and a higher low.
If it breaks to the upside, it is a bullish reversal pattern.
Support Area
Strong support (trendline support) near $0.22–0.225.
As long as this level holds, downside looks limited.
RSI Indicator
RSI = 52.64, above its MA (46.96).
RSI broke its downtrend line → early sign of bullish momentum building.
Moving Average (MA 25)
The price is slightly above the moving average (0.2324), which is a sign of short-term correction.
DYOR | NFA
פרסומים קשורים
כתב ויתור
המידע והפרסומים אינם אמורים להיות, ואינם מהווים, עצות פיננסיות, השקעות, מסחר או סוגים אחרים של עצות או המלצות שסופקו או מאושרים על ידי TradingView. קרא עוד בתנאים וההגבלות.
פרסומים קשורים
כתב ויתור
המידע והפרסומים אינם אמורים להיות, ואינם מהווים, עצות פיננסיות, השקעות, מסחר או סוגים אחרים של עצות או המלצות שסופקו או מאושרים על ידי TradingView. קרא עוד בתנאים וההגבלות.