MATIC / USDT 1D chart Targets and Stoploss
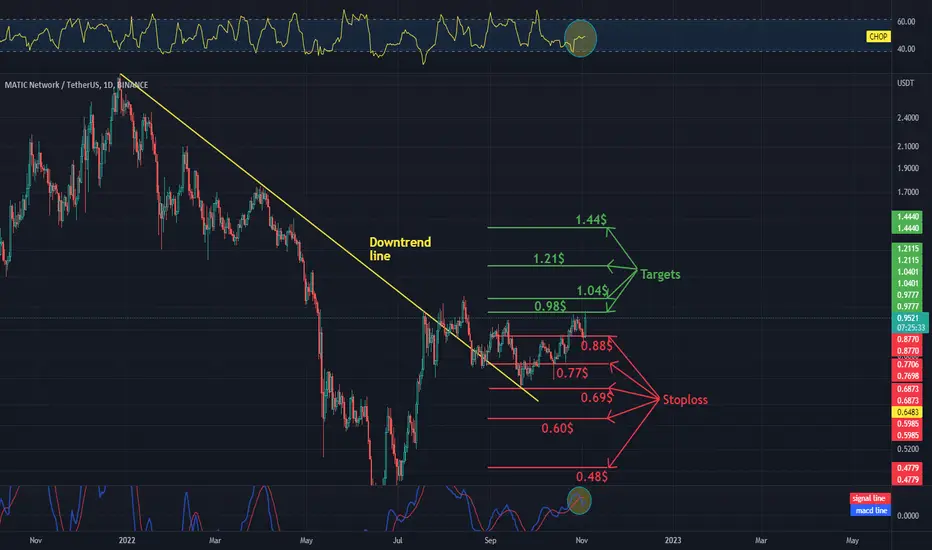
Hello everyone, let's take a look at the 1D MATIC to USDT chart as you can see the price is moving above the downtrend line.
Let's start by setting goals for the near future that we can consider:
T1 = $ 0.98
T2 = $ 1.04
T3 = $ 1.21
and
T4 = $ 1.44
Now let's move on to the stop loss in case of further market declines:
SL1 = $ 0.88
SL2 = $ 0.77
SL3 = $ 0.69
SL4 = $ 0.60
and
SL5 = $ 0.48
Looking at the CHOP indicator, we can see that in the 1D range we have more and more energy, and the MACD indicator shows a downward trend, but it turned sharply up when it crosses the red line from the bottom, confirming the upward trend change.
כתב ויתור
המידע והפרסומים אינם אמורים להיות, ואינם מהווים, עצות פיננסיות, השקעות, מסחר או סוגים אחרים של עצות או המלצות שסופקו או מאושרים על ידי TradingView. קרא עוד בתנאים וההגבלות.
כתב ויתור
המידע והפרסומים אינם אמורים להיות, ואינם מהווים, עצות פיננסיות, השקעות, מסחר או סוגים אחרים של עצות או המלצות שסופקו או מאושרים על ידי TradingView. קרא עוד בתנאים וההגבלות.