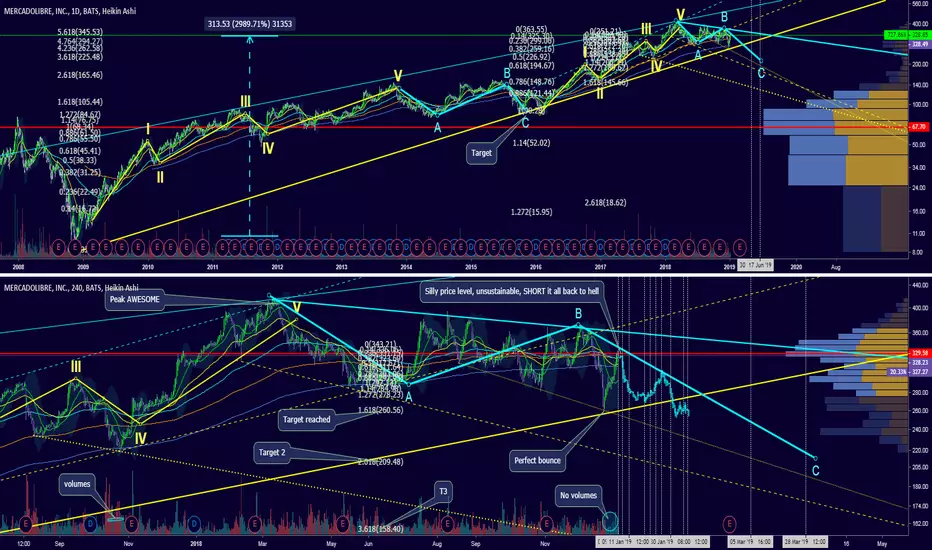
Macro:
Distribution - ABC pattern after 1-5, obvious, obvious
So long at these prices not realistic.
300 was pierced easy, so no real support at 300, thus anything 300+ is running on fumes.
Still part of the emerging market. Stock valuation is of the rockets. -142 PE and -2.3 on EPS
Micro:
Volatile increase toward average high price of 330, when average high is 340.
Macro might push it a bit, but price is not sustainable, Decline is well obvious.
Any lower High, is a sign for the next day drop so have shorts, u never know.
Bull point:
They generate revenue on Earning Report. Positive development of some kind outside of SPY pushing prices up.
Good luck everyone ;)
**LEGENDS**
BLUE = Bear/Resistance
Yellow = Bull/ Support
~Explore the chart for possible scenarios of price actions - use zoom and scroll for better view.~
/*This information is not a recommendation to buy or sell. It is to be used for educational purposes only.*/
If you want your coin to be analyzed, JUST ask.
If you got a question, ASK away!
And please keep those Stop losses in place!
Fractal dates are moments of interest, where price and time collide to create oscillation - vertical lines!
Thank you,
Ajion
Thank you for your support in my efforts to better understand: financial chart behavior and Fractal Universe.
twitter.com/Puniks_
twitter.com/NexusWars_
ajion.org
twitter.com/Puniks_
twitter.com/NexusWars_
ajion.org
כתב ויתור
המידע והפרסומים אינם מיועדים להיות, ואינם מהווים, ייעוץ או המלצה פיננסית, השקעתית, מסחרית או מכל סוג אחר המסופקת או מאושרת על ידי TradingView. קרא עוד ב־תנאי השימוש.