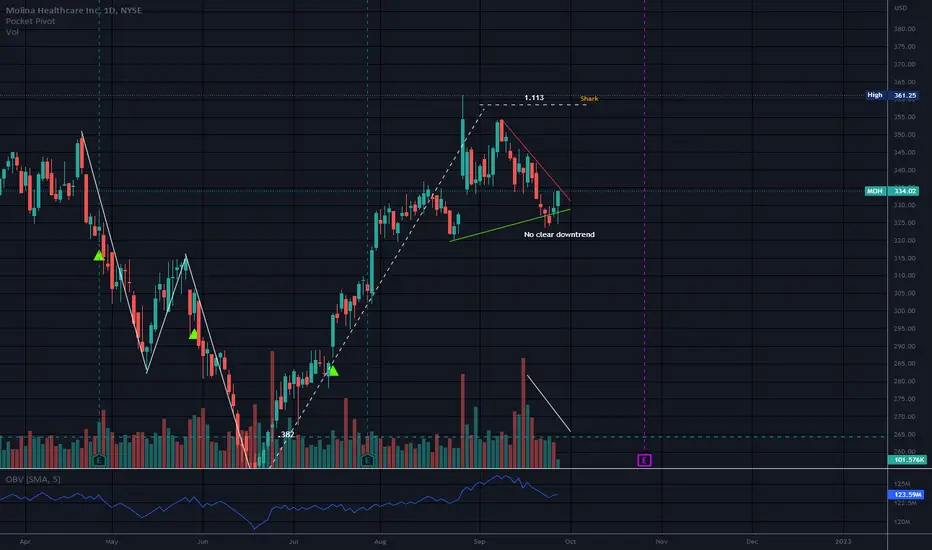
This triangle looked as if it would break to the downside. Now price is back inside the structure but a confirmed downtrend was never established.
This is an example of why it is important to wait for a confirmed downtrend or a confirmed uptrend after the break of a pattern.
Volume declining but this is not unusual in a triangle or a flag pattern.
I do think MOH will go down eventually, but it is almost impossible to know which way this triangle will break.
I learned something new about timing market rallies versus oversold status. The market was very oversold before this bounce so it was a bit obvious it was coming.
But this put/call ratio chart is something I will also look at in the future and I did not know it was on here. This is a Put/Call ratio chart and the ratio is over the bands.

Thank you for the info markrivest (o:
No recommendation
This is an example of why it is important to wait for a confirmed downtrend or a confirmed uptrend after the break of a pattern.
Volume declining but this is not unusual in a triangle or a flag pattern.
I do think MOH will go down eventually, but it is almost impossible to know which way this triangle will break.
I learned something new about timing market rallies versus oversold status. The market was very oversold before this bounce so it was a bit obvious it was coming.
But this put/call ratio chart is something I will also look at in the future and I did not know it was on here. This is a Put/Call ratio chart and the ratio is over the bands.
Thank you for the info markrivest (o:
No recommendation
כתב ויתור
המידע והפרסומים אינם אמורים להיות, ואינם מהווים, עצות פיננסיות, השקעות, מסחר או סוגים אחרים של עצות או המלצות שסופקו או מאושרים על ידי TradingView. קרא עוד בתנאים וההגבלות.
כתב ויתור
המידע והפרסומים אינם אמורים להיות, ואינם מהווים, עצות פיננסיות, השקעות, מסחר או סוגים אחרים של עצות או המלצות שסופקו או מאושרים על ידי TradingView. קרא עוד בתנאים וההגבלות.