Disclaimer: This is my personal analysis for educational purposes only. I am not SEBI-registered. Please consult your financial advisor before making any trading decisions.
🔎 Weekly Chart Setup
On the weekly timeframe, when plotting Fibonacci from the bottom (below 200 EMA) to the top (above 200 EMA):
Price retraced to the 0.5 level.
After holding this zone, it is again moving towards the highs.
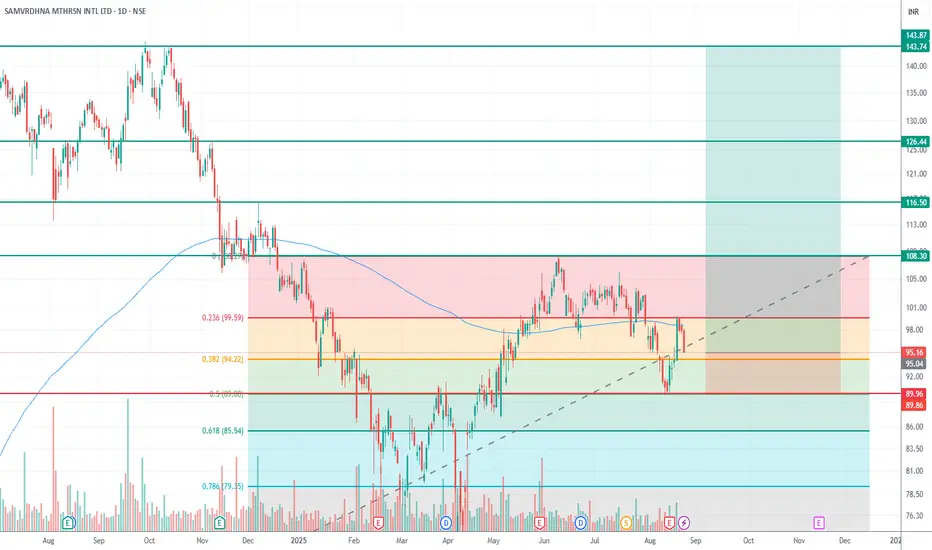
📈 Daily Chart Confirmation
Entry near CMP ~95.16.
Stop Loss: below 0.618 Fibonacci retracement → around 85 (safer SL).
Once the price crosses the first target, SL can be revised upward to the 0.5 level (~89–90).
🎯 Targets
First Target: Weekly high → 103–108
Second Target: 116
Third Target: 126
Final Target: 143
⚖️ Risk-Reward
Initial SL: 85
Entry: 95.16
Multiple profit targets with an approximate R:R > 1:5.
📌 Summary:
Weekly chart supports a bullish continuation after holding the 0.5 retracement.
The daily chart provides a clear risk-defined setup with a stop below 0.618.
Scaling out at targets and trailing SL increases the probability of locking profits.
🔎 Weekly Chart Setup
On the weekly timeframe, when plotting Fibonacci from the bottom (below 200 EMA) to the top (above 200 EMA):
Price retraced to the 0.5 level.
After holding this zone, it is again moving towards the highs.
📈 Daily Chart Confirmation
Entry near CMP ~95.16.
Stop Loss: below 0.618 Fibonacci retracement → around 85 (safer SL).
Once the price crosses the first target, SL can be revised upward to the 0.5 level (~89–90).
🎯 Targets
First Target: Weekly high → 103–108
Second Target: 116
Third Target: 126
Final Target: 143
⚖️ Risk-Reward
Initial SL: 85
Entry: 95.16
Multiple profit targets with an approximate R:R > 1:5.
📌 Summary:
Weekly chart supports a bullish continuation after holding the 0.5 retracement.
The daily chart provides a clear risk-defined setup with a stop below 0.618.
Scaling out at targets and trailing SL increases the probability of locking profits.
עסקה פעילה
First Target of 109 Achievedכתב ויתור
המידע והפרסומים אינם מיועדים להיות, ואינם מהווים, ייעוץ או המלצה פיננסית, השקעתית, מסחרית או מכל סוג אחר המסופקת או מאושרת על ידי TradingView. קרא עוד ב־תנאי השימוש.
כתב ויתור
המידע והפרסומים אינם מיועדים להיות, ואינם מהווים, ייעוץ או המלצה פיננסית, השקעתית, מסחרית או מכל סוג אחר המסופקת או מאושרת על ידי TradingView. קרא עוד ב־תנאי השימוש.