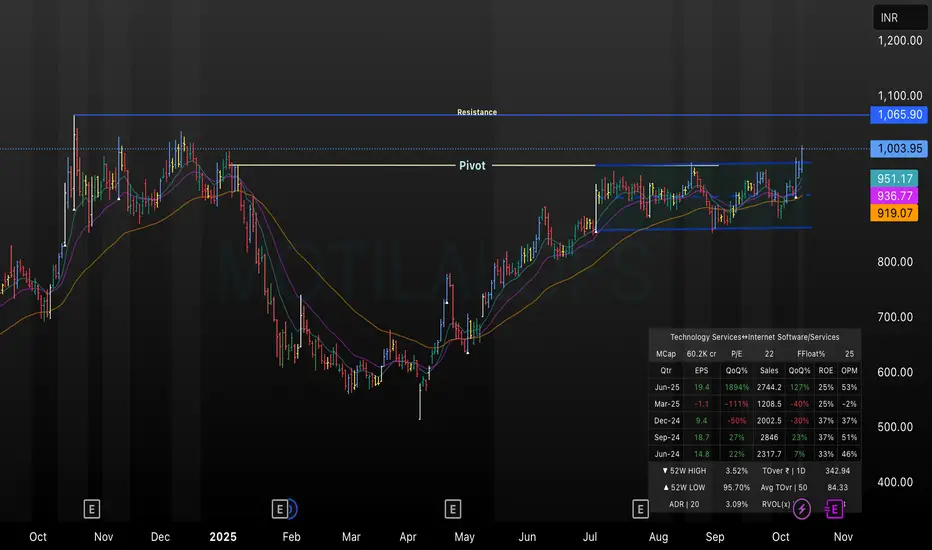
This TradingView chart for Motilal Oswal shows a clear price breakout above the key pivot level near ₹1,003.95, heading towards the marked resistance at ₹1,065.90. The chart uses daily candles and overlays short-to-medium-term EMAs, highlighting recent bullish momentum. The setup suggests a potential trend continuation if the resistance is breached, with all technicals and critical financial data displayed for context.
כתב ויתור
המידע והפרסומים אינם מיועדים להיות, ואינם מהווים, ייעוץ או המלצה פיננסית, השקעתית, מסחרית או מכל סוג אחר המסופקת או מאושרת על ידי TradingView. קרא עוד ב־תנאי השימוש.
כתב ויתור
המידע והפרסומים אינם מיועדים להיות, ואינם מהווים, ייעוץ או המלצה פיננסית, השקעתית, מסחרית או מכל סוג אחר המסופקת או מאושרת על ידי TradingView. קרא עוד ב־תנאי השימוש.