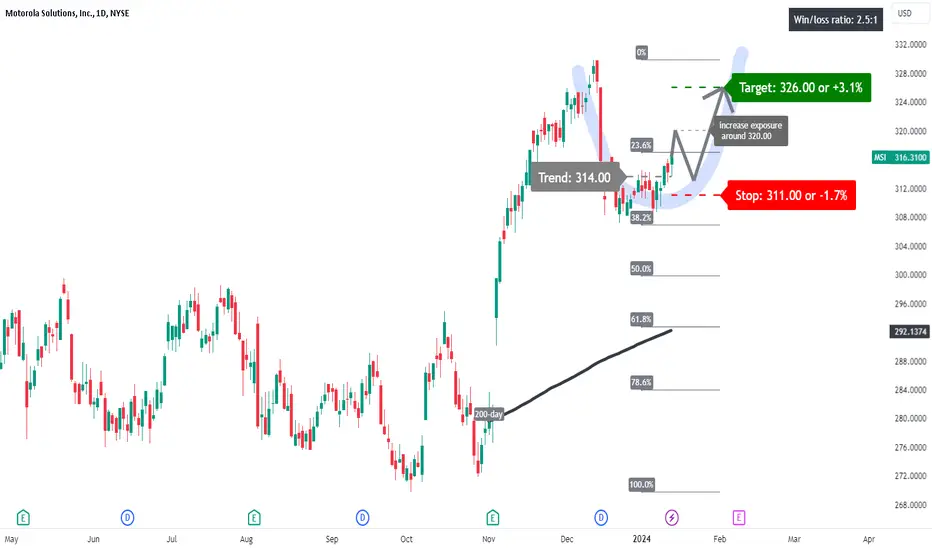
A price action above 314.00 supports a bullish trend direction.
Expect further upside potential for a break above 320.00.
The target price is set at 326.00.
The stop-loss price is set at 311.00.
The U-shaped pattern observed in the price chart may imply a potential for further upward movement in prices. This pattern, often seen as a sign of market recovery or bullish sentiment, suggests that after a period of decline or consolidation, there is a likelihood of price increases as the pattern completes its formation and trends upwards
כתב ויתור
המידע והפרסומים אינם אמורים להיות, ואינם מהווים, עצות פיננסיות, השקעות, מסחר או סוגים אחרים של עצות או המלצות שסופקו או מאושרים על ידי TradingView. קרא עוד בתנאים וההגבלות.
כתב ויתור
המידע והפרסומים אינם אמורים להיות, ואינם מהווים, עצות פיננסיות, השקעות, מסחר או סוגים אחרים של עצות או המלצות שסופקו או מאושרים על ידי TradingView. קרא עוד בתנאים וההגבלות.