Natural Gas (NG) – Multi-Timeframe Technical Analysis
Monthly (1M)
Price has pushed into the 4.80 zone, which corresponds to the previous major monthly high. The last three monthly candles are bullish, showing strong upward momentum, but NG is now entering a significant historical resistance area.
Weekly (1W)
Volume is rising, indicating strong participation. Price bounced cleanly from the retest zone, and the current candle remains green, but buyers are now encountering notable resistance at the top of the range.
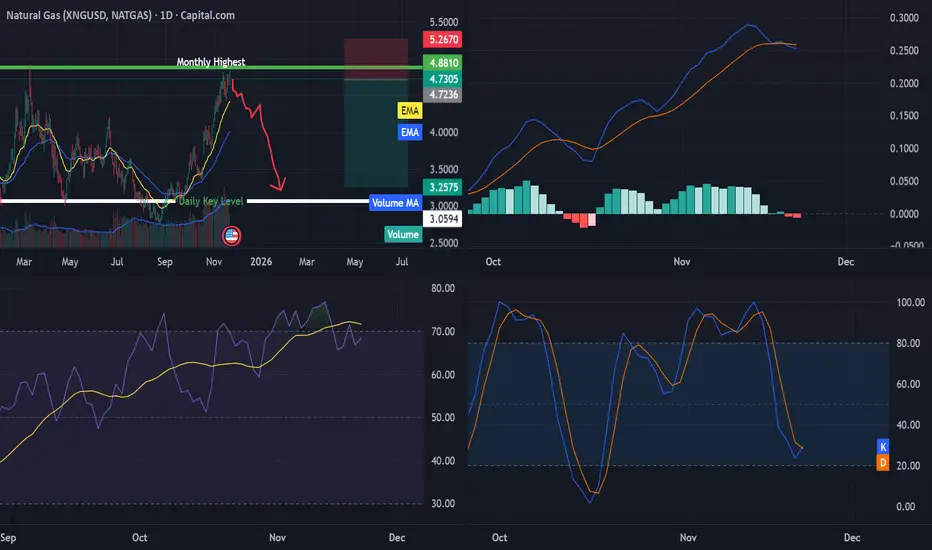
Daily (1D)
Clear wick rejection around 4.85, showing that sellers are defending this level.
MACD is showing mild crossovers and losing momentum.
RSI is overbought and making a bearish crossover — often a sign of short-term exhaustion.
4-Hour (4H)
A potential double-top pattern is forming at the 4.85 resistance, which supports the idea of weakening bullish momentum on the lower timeframes.
Natural Gas remains bullish on higher timeframes, but the 4.80–4.88 zone is acting as a strong resistance cluster. Lower timeframes are already showing signs of momentum fading.
If bulls fail to break above 4.88, a short-term correction is likely.
A clean breakout above this area would invalidate bearish signals and could open the next leg toward higher Fibonacci levels.
Monthly (1M)
Price has pushed into the 4.80 zone, which corresponds to the previous major monthly high. The last three monthly candles are bullish, showing strong upward momentum, but NG is now entering a significant historical resistance area.
Weekly (1W)
Volume is rising, indicating strong participation. Price bounced cleanly from the retest zone, and the current candle remains green, but buyers are now encountering notable resistance at the top of the range.
Daily (1D)
Clear wick rejection around 4.85, showing that sellers are defending this level.
MACD is showing mild crossovers and losing momentum.
RSI is overbought and making a bearish crossover — often a sign of short-term exhaustion.
4-Hour (4H)
A potential double-top pattern is forming at the 4.85 resistance, which supports the idea of weakening bullish momentum on the lower timeframes.
Natural Gas remains bullish on higher timeframes, but the 4.80–4.88 zone is acting as a strong resistance cluster. Lower timeframes are already showing signs of momentum fading.
If bulls fail to break above 4.88, a short-term correction is likely.
A clean breakout above this area would invalidate bearish signals and could open the next leg toward higher Fibonacci levels.
כתב ויתור
המידע והפרסומים אינם מיועדים להיות, ואינם מהווים, ייעוץ או המלצה פיננסית, השקעתית, מסחרית או מכל סוג אחר המסופקת או מאושרת על ידי TradingView. קרא עוד ב־תנאי השימוש.
כתב ויתור
המידע והפרסומים אינם מיועדים להיות, ואינם מהווים, ייעוץ או המלצה פיננסית, השקעתית, מסחרית או מכל סוג אחר המסופקת או מאושרת על ידי TradingView. קרא עוד ב־תנאי השימוש.