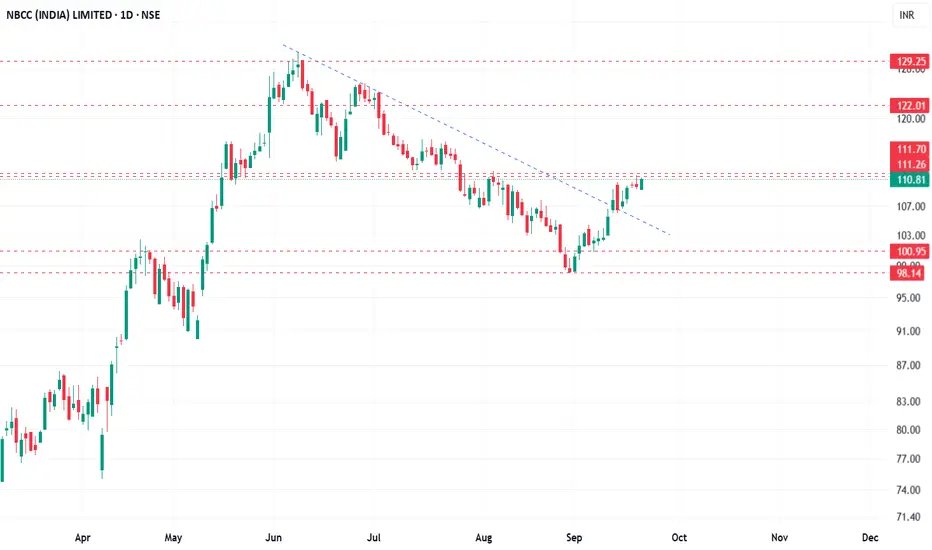
🔎 Technical Chart Analysis (Daily)
1. Price Structure & Trend
The stock rallied sharply till June 2025 (~₹129), followed by a correction.
Formed a falling trendline resistance, which has now been broken on the upside, indicating a shift from correction to recovery.
Currently consolidating around ₹110–112, which is a key resistance zone.
2. Key Levels
Immediate Support: ₹101, followed by ₹98.
Immediate Resistance: ₹111–112 (current hurdle).
Next Resistance: ₹122 and then ₹129 (previous swing high).
3. Pattern Observation
The stock is attempting a trend reversal breakout from a falling channel / descending trendline.
Sustaining above ₹112 can confirm short-term bullish momentum.
4. Momentum & Price Action
Short-term bullish momentum seen with higher lows from September.
A decisive close above ₹112 will invite fresh buying interest.
If rejected here, price may retest ₹101–₹103 zone before another attempt upward.
📈 Possible Scenarios
✅ Bullish Case
Breakout and sustain above ₹112 → Upside potential toward ₹122, and eventually retest ₹129 (swing high).
⚠️ Bearish Case
Rejection at ₹112 → Pullback toward supports at ₹101 and ₹98.
Breakdown below ₹98 may open downside to ₹92–95.
📝 Analyst View (Summary)
Trend: Recovering from correction, short-term reversal visible.
Key Zone to Watch: ₹111–112 breakout.
Bias: Positive above ₹101.
Targets (if breakout holds): ₹122 → ₹129.
⚠️ Disclaimer
This analysis is for educational and informational purposes only. It should not be considered investment advice or a recommendation to buy/sell. Equity investments involve risks. Please consult with financial advisor before making any investment decisions.
כתב ויתור
המידע והפרסומים אינם אמורים להיות, ואינם מהווים, עצות פיננסיות, השקעות, מסחר או סוגים אחרים של עצות או המלצות שסופקו או מאושרים על ידי TradingView. קרא עוד בתנאים וההגבלות.
כתב ויתור
המידע והפרסומים אינם אמורים להיות, ואינם מהווים, עצות פיננסיות, השקעות, מסחר או סוגים אחרים של עצות או המלצות שסופקו או מאושרים על ידי TradingView. קרא עוד בתנאים וההגבלות.