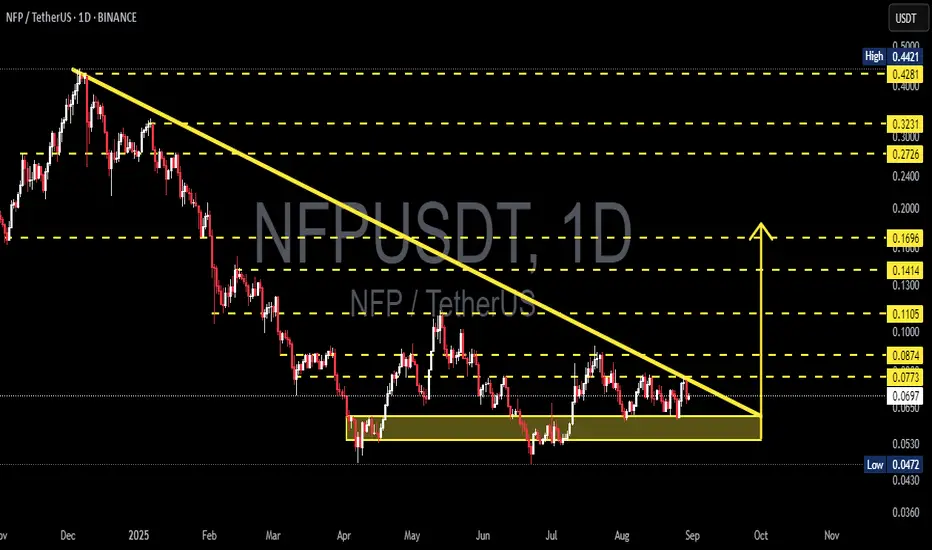
The pair NFP/USDT is currently at a critical juncture. The chart shows a clear Descending Triangle pattern: a series of lower highs (seller pressure) aligned with a falling trendline, while a strong horizontal support zone around 0.047 – 0.062 continues to hold as buyers defend it.
Typically, this formation suggests a bearish continuation, but as the price approaches the triangle’s apex, the probability of a bullish breakout also rises if supported by strong volume. In other words, NFP is now in a “do or die” position — preparing for its next major move.
---
🔎 Technical Structure & Key Levels
Main Pattern: Descending Triangle → generally bearish bias, but breakout upside is possible.
Current Price: ~ 0.0697, very close to the apex, signaling an upcoming strong move.
Strong Support Zone: 0.047 – 0.062 (demand area repeatedly tested).
Key Resistance near trendline: 0.077 – 0.087 (bullish breakout confirmation zone).
Next Resistances: 0.1105, 0.1414, 0.1696, then 0.2726 – 0.3231, and 0.4421 (major historical resistance).
---
📈 Bullish Scenario — Breakout Potential
If NFP breaks above the descending trendline and closes a daily candle above 0.077 – 0.087 with strong volume, a medium-term reversal could be underway.
🎯 Short-term target: 0.1105
🎯 Next targets: 0.1414 – 0.1696
🎯 Extended targets: 0.2726 – 0.3231, up to 0.4421 if momentum sustains
🔑 Additional confirmation: successful retest of the breakout zone, proving buyer strength.
---
📉 Bearish Scenario — Breakdown Continuation
If price breaks below the strong support 0.0472, the descending triangle confirms as a bearish continuation pattern.
🎯 First target: 0.036 – 0.030 (next historical support zone).
🎯 Deeper targets possible if selling pressure accelerates.
🔑 Additional confirmation: failed retest of the broken support, turning into resistance.
---
⚖️ Key Takeaways
NFP/USDT is at a decision point. The descending triangle is tightening and a big move is near.
Bias: Slightly bearish due to the pattern, but bullish reversal remains possible with a breakout above 0.087 and strong volume.
Conservative traders: Wait for confirmation before entry. False breakouts/breakdowns are common without volume.
Risk management is crucial: set stop-loss below the support zone for longs, or above breakout levels for shorts.
---
As price approaches the apex of the triangle, volatility usually spikes. That means a decisive move is coming soon — either a breakout rally or a bearish continuation. For now, NFP/USDT is a must-watch: will buyers flip the script, or will sellers win the battle?
#NFP #NFPUSDT #Crypto #TechnicalAnalysis #DescendingTriangle #SupportResistance #Breakout #BearishOrBullish #CryptoTrading
✅ Get Free Signals! Join Our Telegram Channel Here: t.me/TheCryptoNuclear
✅ Twitter: twitter.com/crypto_nuclear
✅ Join Bybit : partner.bybit.com/b/nuclearvip
✅ Benefits : Lifetime Trading Fee Discount -50%
✅ Twitter: twitter.com/crypto_nuclear
✅ Join Bybit : partner.bybit.com/b/nuclearvip
✅ Benefits : Lifetime Trading Fee Discount -50%
כתב ויתור
המידע והפרסומים אינם אמורים להיות, ואינם מהווים, עצות פיננסיות, השקעות, מסחר או סוגים אחרים של עצות או המלצות שסופקו או מאושרים על ידי TradingView. קרא עוד בתנאים וההגבלות.