Disclaimer: This analysis is for educational purposes only and does not constitute investment advice. Please do your own research (DYOR) before making any trading decisions.
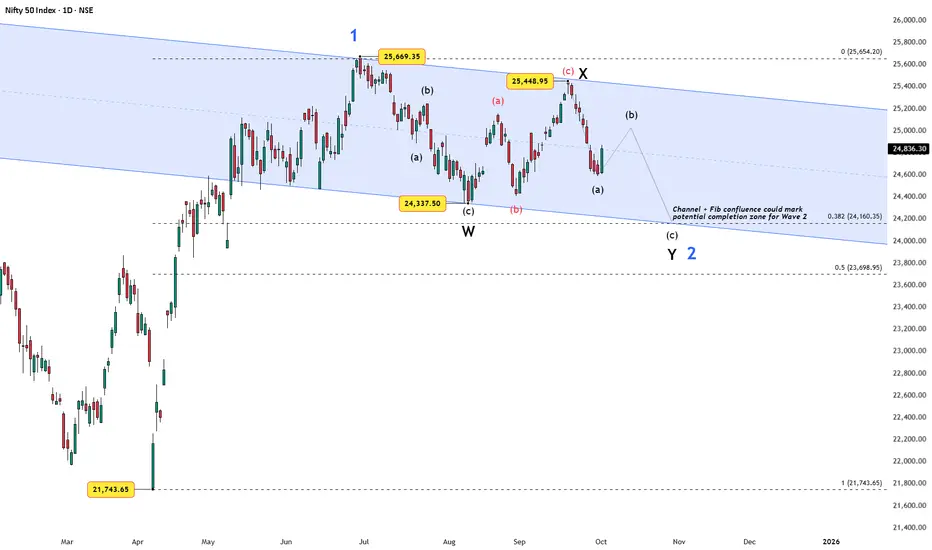
After bottoming at 21,743.65 in March 2025, Nifty launched a strong impulsive rally that topped at 25,669.35, marking Wave 1 of a new higher-degree advance.
Since then, price has been moving inside a downward-sloping channel, forming what appears to be a Wave 2 correction.
The subdivisions so far suggest a W–X–Y structure:
To assess possible completion zones, Fibonacci retracements of Wave 1 offer key checkpoints:
This channel + fib confluence provides a meaningful area where Wave 2 could terminate, setting the stage for the next bullish leg — Wave 3.
Key Levels:
Alternate scenario: If price continues sideways without decisive weakness, the correction may evolve into a triangle for Wave 2 instead of a W–X–Y.
Takeaway: As long as price respects the channel and fib zones, Wave 2 remains corrective in nature. A sustained break higher would open the path for Wave 3 — the next impulsive advance.
After bottoming at 21,743.65 in March 2025, Nifty launched a strong impulsive rally that topped at 25,669.35, marking Wave 1 of a new higher-degree advance.
Since then, price has been moving inside a downward-sloping channel, forming what appears to be a Wave 2 correction.
The subdivisions so far suggest a W–X–Y structure:
- Wave W ended at 24,337.50.
- Wave X topped at 25,448.95.
- Wave Y is now unfolding, with (a) in place, (b) potentially in progress, and (c) likely still pending.
To assess possible completion zones, Fibonacci retracements of Wave 1 offer key checkpoints:
- 0.382 retracement at ~24,160, aligning with the channel base.
- 0.5 retracement at ~23,699, a deeper but still acceptable Wave 2 target.
This channel + fib confluence provides a meaningful area where Wave 2 could terminate, setting the stage for the next bullish leg — Wave 3.
Key Levels:
- Resistance: 25,450 – 25,670 (breakout here invalidates the immediate Wave 2 scenario).
- Support: 24,160 (0.382 fib and channel base).
- Deeper support: 23,700 (0.5 fib).
Alternate scenario: If price continues sideways without decisive weakness, the correction may evolve into a triangle for Wave 2 instead of a W–X–Y.
Takeaway: As long as price respects the channel and fib zones, Wave 2 remains corrective in nature. A sustained break higher would open the path for Wave 3 — the next impulsive advance.
WaveXplorer | Elliott Wave insights
📊 X profile: @veerappa89
📊 X profile: @veerappa89
פרסומים קשורים
כתב ויתור
המידע והפרסומים אינם אמורים להיות, ואינם מהווים, עצות פיננסיות, השקעות, מסחר או סוגים אחרים של עצות או המלצות שסופקו או מאושרים על ידי TradingView. קרא עוד בתנאים וההגבלות.
WaveXplorer | Elliott Wave insights
📊 X profile: @veerappa89
📊 X profile: @veerappa89
פרסומים קשורים
כתב ויתור
המידע והפרסומים אינם אמורים להיות, ואינם מהווים, עצות פיננסיות, השקעות, מסחר או סוגים אחרים של עצות או המלצות שסופקו או מאושרים על ידי TradingView. קרא עוד בתנאים וההגבלות.