📊 Chart Structure Overview
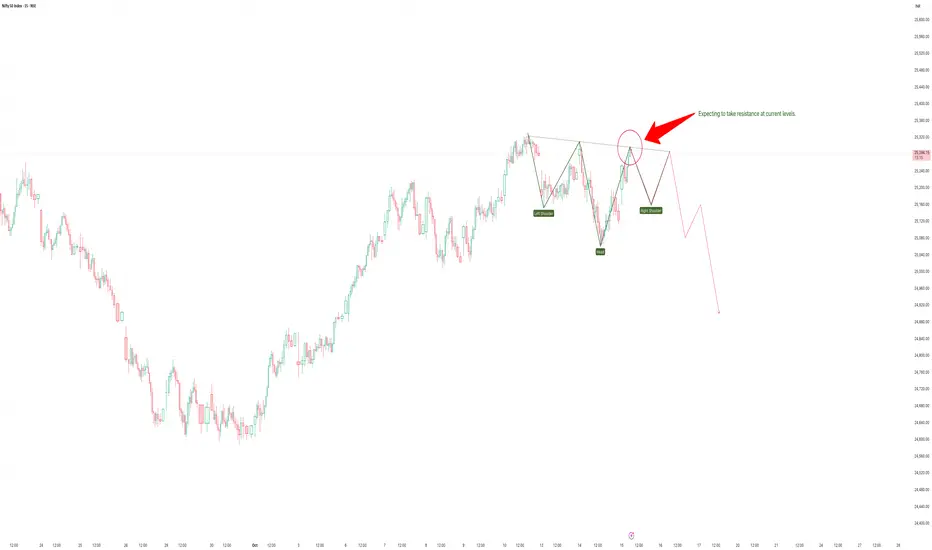
The chart clearly displays a Head and Shoulders (H&S) formation — a bearish reversal pattern developing after a strong uptrend.
Left Shoulder: Around 25,350 region
Head: Formed near 25,475
Right Shoulder: Currently forming near 25,330–25,350
Neckline: Roughly around 25,120
You’ve correctly marked “Expecting to take resistance at current levels”, which aligns with the right shoulder zone, a classical point for potential downside reversal.
⚙️ Pattern Implications
Scenario 1 – Breakdown Confirmation (Bearish)
A decisive break below the neckline (≈25,120) with volume confirmation would validate the pattern.
Projected target:
Height of the head-to-neckline ≈ 350 points →
Breakdown target zone = 25,120 – 350 = 24,770
→ Immediate supports: 24,950 → 24,770 → 24,680
Scenario 2 – Rejection Fails (Bullish Reversal Invalidated)
If Nifty closes above 25,380–25,400 with momentum, the right shoulder fails.
That could lead to short covering up to 25,500–25,550 before re-evaluating the bearish bias.
🔍 Volume & Momentum
Volume shows diminishing strength during the recent right shoulder rise — typical in a distribution phase.
RSI (if plotted) would likely show bearish divergence — price making lower high vs. RSI making higher high.
This supports your expectation of rejection near current resistance.
🧭 Short-Term View (Next 1–3 Sessions)
Bias Level Action
Bearish below 25,120 Breakdown confirmation → expect 24,950 → 24,770
Neutral zone 25,120–25,350 Wait for candle confirmation near neckline
Bullish reversal only above 25,400 Pattern invalidation; potential push to 25,500–25,550
🧠 Conclusion
The Head & Shoulders pattern near the top suggests distribution and possible short-term correction.
Expect pullback rejection near 25,330–25,350 and a move toward 25,000–24,800 if neckline breaks.
Keep stops above 25,400 for short setups.
Summary:
✅ Pattern: Head & Shoulders
⚠️ Trigger Point: Breakdown below 25,120
🎯 Target Zone: 24,950–24,770
🔒 Stop-loss (for shorts): 25,400
Disclaimer:
This analysis is for educational and technical research purposes only, not financial advice. Market movements are subject to volatility; always confirm with your own entry and risk parameters before trading.
כתב ויתור
המידע והפרסומים אינם אמורים להיות, ואינם מהווים, עצות פיננסיות, השקעות, מסחר או סוגים אחרים של עצות או המלצות שסופקו או מאושרים על ידי TradingView. קרא עוד בתנאים וההגבלות.
כתב ויתור
המידע והפרסומים אינם אמורים להיות, ואינם מהווים, עצות פיננסיות, השקעות, מסחר או סוגים אחרים של עצות או המלצות שסופקו או מאושרים על ידי TradingView. קרא עוד בתנאים וההגבלות.