💼 NIFTY TRADING PLAN – 10-Oct-2025
📊 Chart Timeframe: 15-min
📍 Last Close: 25,170.30 | 🔻 Change: -7.40 pts (-0.03%)
📅 Analysis Based on Psychological & Technical Levels
🔍 Key Technical Zones
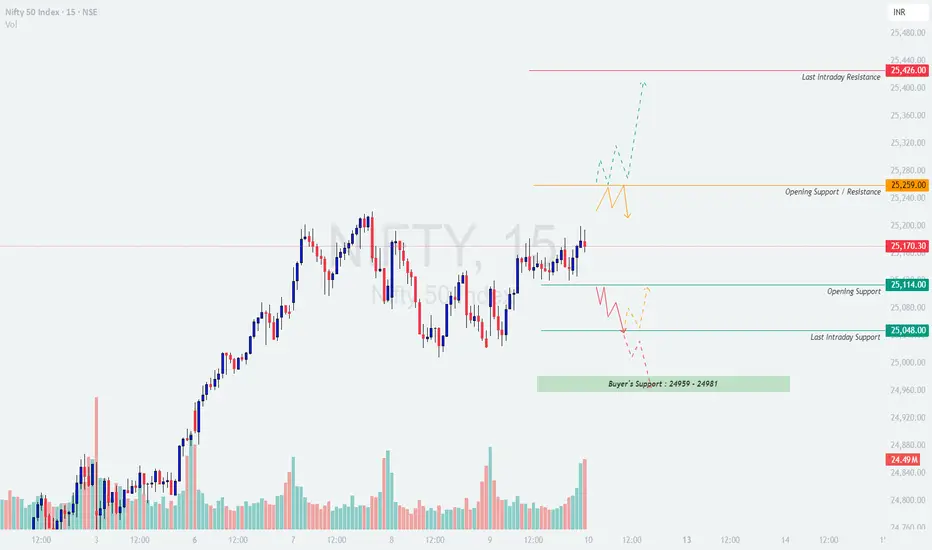
🟧 Opening Support / Resistance: 25,259
🟥 Last Intraday Resistance: 25,426
🟩 Opening Support: 25,114
🟢 Last Intraday Support: 25,048
💚 Buyer’s Support Zone: 24,959 – 24,981
🚀 Scenario 1 – Gap Up Opening (100+ pts above 25,270)
If Nifty opens near or above 25,270, it will directly approach the opening resistance zone.
🧠 Educational Insight:
Gap-up openings near resistance often create a “trap zone.” Patience is key — let the price test and confirm breakout strength before entering directional trades.
⚖️ Scenario 2 – Flat Opening (Around 25,150 ± 50 pts)
A flat start indicates market indecision and provides both long and short opportunities based on level reactions.
💡 Educational Note:
Flat openings favor disciplined traders who react to confirmation rather than prediction. Combining 15-min chart patterns with volume clues gives higher probability entries.
📉 Scenario 3 – Gap Down Opening (100+ pts below 25,060)
If Nifty opens around or below 25,060, it enters the support testing zone.
🧠 Educational Insight:
Gap-down openings can trigger emotional decisions — let the first 30 minutes unfold before entering trades. Reversal setups are only valid with clear rejection wicks or bullish engulfing candles near key supports.
🛡️ Risk Management Tips for Options Traders
📊 Summary & Conclusion
🎯 Focus Zone for 10-Oct-2025:
🟩 25,048 → 24,959 (Buyers’ Defensive Zone)
🟥 25,259 → 25,426 (Sellers’ Dominance Zone)
📢 Disclaimer:
I am not a SEBI-registered analyst. This analysis is purely for educational and informational purposes. Traders should perform their own due diligence or consult with a financial advisor before making trading decisions.
📊 Chart Timeframe: 15-min
📍 Last Close: 25,170.30 | 🔻 Change: -7.40 pts (-0.03%)
📅 Analysis Based on Psychological & Technical Levels
🔍 Key Technical Zones
🟧 Opening Support / Resistance: 25,259
🟥 Last Intraday Resistance: 25,426
🟩 Opening Support: 25,114
🟢 Last Intraday Support: 25,048
💚 Buyer’s Support Zone: 24,959 – 24,981
🚀 Scenario 1 – Gap Up Opening (100+ pts above 25,270)
If Nifty opens near or above 25,270, it will directly approach the opening resistance zone.
- []A sustained move above 25,259 with strong green candles could trigger momentum buying toward 25,426, which is the last intraday resistance.
[]Avoid chasing the first 15 minutes — wait for a minor pullback to 25,259–25,280 and look for support confirmation before going long.
[]If Nifty fails to sustain above 25,259, expect short-term profit booking that can drag prices toward 25,170 or even 25,114.
[]Fresh shorts should be avoided until there’s a confirmed reversal candle near 25,400–25,426, as this area may trigger volatility and fake breakouts.]
🧠 Educational Insight:
Gap-up openings near resistance often create a “trap zone.” Patience is key — let the price test and confirm breakout strength before entering directional trades.
⚖️ Scenario 2 – Flat Opening (Around 25,150 ± 50 pts)
A flat start indicates market indecision and provides both long and short opportunities based on level reactions.
- []If the index sustains above 25,170–25,200, buyers may attempt to push prices toward 25,259 → 25,426. Watch for volume expansion to confirm momentum.
[]If Nifty rejects 25,259, expect a dip toward 25,114–25,048, which will act as short-term intraday supports.
[]Buyers can look for reversal confirmation from 25,048–25,114 zone for potential bounce trades.
[]A decisive hourly close below 25,048 may shift intraday trend bearish toward 24,981–24,959 (Buyer’s Support Zone).]
💡 Educational Note:
Flat openings favor disciplined traders who react to confirmation rather than prediction. Combining 15-min chart patterns with volume clues gives higher probability entries.
📉 Scenario 3 – Gap Down Opening (100+ pts below 25,060)
If Nifty opens around or below 25,060, it enters the support testing zone.
- []Monitor early reactions near 25,048–25,020. A quick recovery from this area can lead to a short-covering rally back toward 25,114–25,170.
[]If the index sustains below 25,020, expect a gradual slide toward the Buyer’s Support Zone (24,959–24,981) — a critical area where bulls might attempt to defend.
[]Failure to hold 24,959 could invite further downside toward 24,880–24,840, so avoid catching a falling knife without confirmation.
[]Intraday traders should prefer trading only on sustained 15-min candle closes below key levels to avoid whipsaws.]
🧠 Educational Insight:
Gap-down openings can trigger emotional decisions — let the first 30 minutes unfold before entering trades. Reversal setups are only valid with clear rejection wicks or bullish engulfing candles near key supports.
🛡️ Risk Management Tips for Options Traders
- []Limit trade exposure to 2–3% of total capital per trade.
[]Always use a stop loss based on 15-min candle close to avoid fake breakouts.
[]Prefer ATM or slightly ITM options for better delta and reduced time decay.
[]Avoid holding losing positions after 2:45 PM, as premium decay accelerates.
[]When volatility rises, use spreads (Bull Call / Bear Put) to manage theta and vega risk.
[]Never average losing trades — protect capital before chasing profit. 💎
📊 Summary & Conclusion
- []Nifty remains in a neutral-to-bullish structure, as long as it sustains above 25,048.
[]Upside momentum may resume only above 25,259, targeting 25,426.
[]A breakdown below 25,048 could shift control to sellers, pulling prices toward 24,981–24,959.
[]Traders should watch 15-min closing confirmations and volume expansion before taking directional positions.]
🎯 Focus Zone for 10-Oct-2025:
🟩 25,048 → 24,959 (Buyers’ Defensive Zone)
🟥 25,259 → 25,426 (Sellers’ Dominance Zone)
📢 Disclaimer:
I am not a SEBI-registered analyst. This analysis is purely for educational and informational purposes. Traders should perform their own due diligence or consult with a financial advisor before making trading decisions.
כתב ויתור
המידע והפרסומים אינם מיועדים להיות, ואינם מהווים, ייעוץ או המלצה פיננסית, השקעתית, מסחרית או מכל סוג אחר המסופקת או מאושרת על ידי TradingView. קרא עוד ב־תנאי השימוש.
כתב ויתור
המידע והפרסומים אינם מיועדים להיות, ואינם מהווים, ייעוץ או המלצה פיננסית, השקעתית, מסחרית או מכל סוג אחר המסופקת או מאושרת על ידי TradingView. קרא עוד ב־תנאי השימוש.